


Search 12,100+ Infographics!
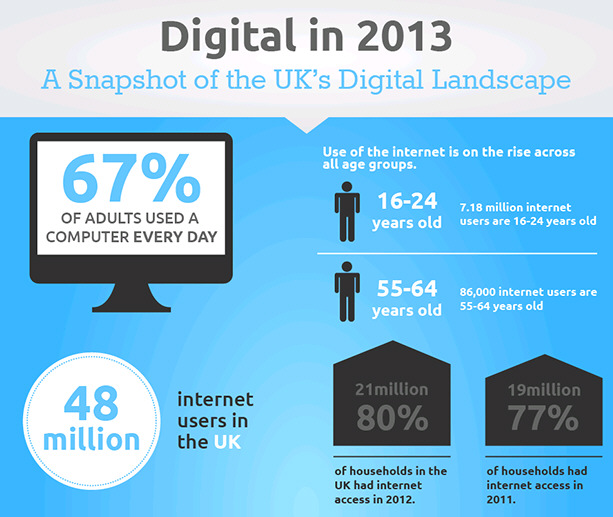
The 2013 U.K. Digital Landscape
This infographic from MySocialAgency provides a snapshot of the UK’s digital landscape in 2013 and how it has evolved in the last few years.
America’s Favorite Sports Car
Americans sure do love their automobiles, and the Porsche 911 is one of them. The 911 has actually been dubbed America’s favorite sports car, and with good reason. The car has been featured in many motion pictures and has been cherished by fans since the very beginning. Check out the infographic below presented by The Auto Gallery to learn more about the Porsche 911.
Uninsured Motorists!
New York is a ruthless place for drivers. With bumper-to-bumper traffic, gridlocked streets and constant construction, driving has become more of a burden than a benefit. Because of these factors, New York is regarded as one of the most accident-prone states, which is bad news for the average 1 in 7 drivers who do not have insurance. Shockingly, an estimated 13.8% of motorists are uninsured, despite their annual $10.8 billion owed in damages to insured drivers. Learn more in the following infographic from New York Motor Insurance.

The Study Habits of Online Students
One of the most valued aspects of online learning schools is that you can do it at home, in your local coffee shop, library and just about anywhere your heart desires. Working students, parents and active-duty military worldwide benefit from this particular feature of online learning.
Internet Explorer Still Top Choice for Web-Based Email
Email and web users worldwide now have access to more browsers than ever before. Existing browsers they know and love compete with brand new browsers they can explore. So, which browsers do users prefer? Does it vary between email browsing and general browsing? Litmus takes a look in the following infographic.
Benefits of Basic Beauty Regiments
Grandmother wasn’t far off when she recognized the importance of basic beauty maintenance. While the propellants of certain beauty regiments are generally based around aesthetics, there are quite a number of health benefits to a person’s morning “beauty” ritual. eCellulitis.com takes a look at some of the old-school beauty secrets that also assist in healthy up-keeping.
Which Social Networks & Tools are Right For Your Business?
Developing a social media presence for your Small Business is vitally important in today’s world. Small business owners may find it difficult to devote time to create and manage content on this new channel. With the help of a strategic plan and good marketing sense, any business can successfully set up and manage a social media presence. Learn which social media sites are right for your business in this infographic.
Siri vs. Google Voice Search
The mobile wars are heating up again with Google and Apple going head to head in what many believe to be one of the most important technology battles yet: Apple’s Siri vs. Google Voice Search. Think you know everything about this battling duo? Check out this infographic to find out how it all began, the incredible amount of money spent on mobile patents, and some of the key differences in their approach to delivering mobile solutions.
How Algorithms Changed the World
If it weren’t for algorithms we wouldn’t have the Internet, operating systems and many other wonderful luxuries that we have today. Check out the infographic below to learn about how algorithms changed the world.
A Guide to Organizing Your Wardrobe
Take the time to clear out all the clothes that don’t suit you and find a system for storing the remainder. You will end up with a streamlined wardrobe with clothes that are easy to find instead of being scrunched up on the floor. Try color coordinating items of clothing to find different outfit combinations. This and other tips below in the following infographic from the folks at Apartment Geeks.
The 2013 U.K. Digital Landscape
This infographic from MySocialAgency provides a snapshot of the UK’s digital landscape in 2013 and how it has evolved in the last few years.
America’s Favorite Sports Car
Americans sure do love their automobiles, and the Porsche 911 is one of them. The 911 has actually been dubbed America’s favorite sports car, and with good reason. The car has been featured in many motion pictures and has been cherished by fans since the very beginning. Check out the infographic below presented by The Auto Gallery to learn more about the Porsche 911.
Uninsured Motorists!
New York is a ruthless place for drivers. With bumper-to-bumper traffic, gridlocked streets and constant construction, driving has become more of a burden than a benefit. Because of these factors, New York is regarded as one of the most accident-prone states, which is bad news for the average 1 in 7 drivers who do not have insurance. Shockingly, an estimated 13.8% of motorists are uninsured, despite their annual $10.8 billion owed in damages to insured drivers. Learn more in the following infographic from New York Motor Insurance.
The Study Habits of Online Students
One of the most valued aspects of online learning schools is that you can do it at home, in your local coffee shop, library and just about anywhere your heart desires. Working students, parents and active-duty military worldwide benefit from this particular feature of online learning.
Internet Explorer Still Top Choice for Web-Based Email
Email and web users worldwide now have access to more browsers than ever before. Existing browsers they know and love compete with brand new browsers they can explore. So, which browsers do users prefer? Does it vary between email browsing and general browsing? Litmus takes a look in the following infographic.
Benefits of Basic Beauty Regiments
Grandmother wasn’t far off when she recognized the importance of basic beauty maintenance. While the propellants of certain beauty regiments are generally based around aesthetics, there are quite a number of health benefits to a person’s morning “beauty” ritual. eCellulitis.com takes a look at some of the old-school beauty secrets that also assist in healthy up-keeping.
Which Social Networks & Tools are Right For Your Business?
Developing a social media presence for your Small Business is vitally important in today’s world. Small business owners may find it difficult to devote time to create and manage content on this new channel. With the help of a strategic plan and good marketing sense, any business can successfully set up and manage a social media presence. Learn which social media sites are right for your business in this infographic.
Siri vs. Google Voice Search
The mobile wars are heating up again with Google and Apple going head to head in what many believe to be one of the most important technology battles yet: Apple’s Siri vs. Google Voice Search. Think you know everything about this battling duo? Check out this infographic to find out how it all began, the incredible amount of money spent on mobile patents, and some of the key differences in their approach to delivering mobile solutions.
How Algorithms Changed the World
If it weren’t for algorithms we wouldn’t have the Internet, operating systems and many other wonderful luxuries that we have today. Check out the infographic below to learn about how algorithms changed the world.
A Guide to Organizing Your Wardrobe
Take the time to clear out all the clothes that don’t suit you and find a system for storing the remainder. You will end up with a streamlined wardrobe with clothes that are easy to find instead of being scrunched up on the floor. Try color coordinating items of clothing to find different outfit combinations. This and other tips below in the following infographic from the folks at Apartment Geeks.
Partners


Browse Archives By Category
Animated Infographics
Business Infographics
Career & Jobs Infographics
Education Infographics
Entertainment Industry Infographics
Environmental Infographics
Finance & Money Infographics
Food & Drink Infographics
Health Infographics
Historical Infographics
Home & Garden Infographics
Internet Infographics
Law and Legal Infographics
Lifestyle Infographics
Marketing Infographics
Offbeat Infographics
Parenting Infographics
Pets & Animals Infographics
Political Infographics
Shopping Infographics
Sports and Athletic Infographics
Technology Infographics
Transportation Infographics
Travel Infographics
Video Infographics