


Search 12,100+ Infographics!

What’s Driving Pay TV Growth in Europe?
Even though pay TV is declining in the Untied States, Europe is seeing a growth. So what exactly is creating this growth? Check out the infographic below presented by ClickSoftware to learn more about it.
Broken Unions: Divorce in the USA
An estimated one million divorces occur ever year. Seems like divorce is all around us these days. Not only are people getting divorced, but some people are actually afraid to get married because of divorce. Check out this infographic presented by InsuranceQuotes to learn more about divorce trends in the U.S.
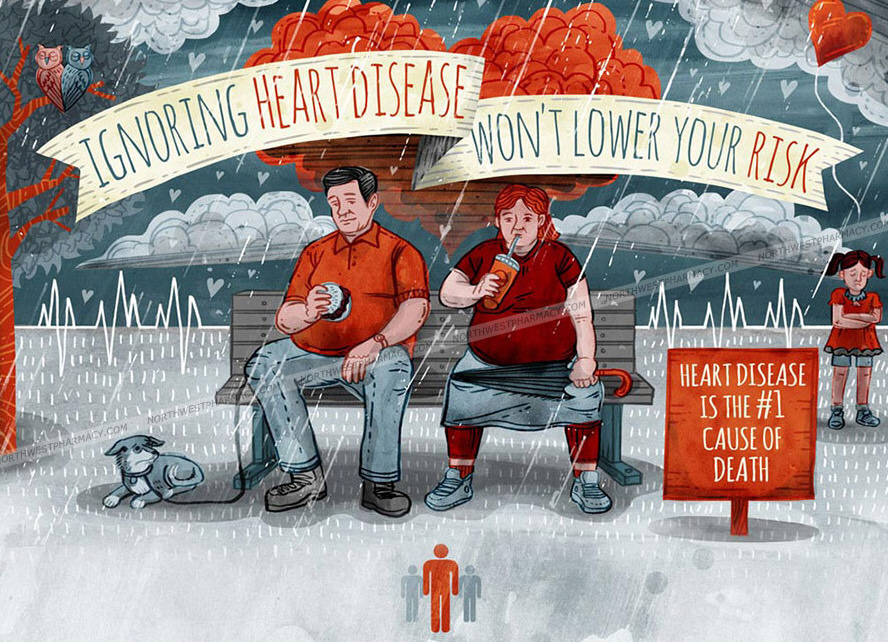
Ignoring Heart Disease Won’t Lower Your Risk
Heart Disease is the number one cause of death in America. Each day an average of 2,200 people die from heart disease, while 56% of adults have been told by a health care professional to improve their health to lower their risk. Unfortunately, the vast majority of Americans are just not motivated to do anything about it. When the statistics show that 1 in 3 deaths in the United States are caused by heart disease, you have no other choice then to take this disease seriously before it is too late.

Nicotine – The Effects and Consequences
Nicotine is behind one of the most damaging habits in the United States: cigarette smoking. This addiction can have dire consequences not just for the user, but for those in close and frequent proximity to them. Approximately 1 in 4 teens become smokers, and 80% of those will continue to smoke into adulthood.
Motorcycle Theft – Don’t Become A Statistic
If you own a motorbike or are thinking about getting one then you need to take a look at this infographic, which shows you just how at risk you might be from having that expensive purchase stolen. Have a look at these statistics and make sure that you don’t become one.

Business Card Design Psychology
This infographic by CardPrinting.us is about how to design your business card in such a way that it will achieve aesthetic value and message clarity. With the help of a few basic principles of design, anyone who reads this infographic will be able to fine-tune the color combination, define character and personality as well as create subtle visual suggestion using whitespace in designing.
How To Control Your Dreams
Have you ever wanted to write a blockbuster novel, or star in a film with your favorite actor? Occasionally our dreams allow us to do this but for total control you need to learn how to practice lucid dreaming. With the following helpful suggestions, you might turn those hours spent sleeping into something more productive.
A Taste of History: Sushi Then and Now
There’s almost nothing like good sushi. Sushi’s fascinating history is only rivaled by its delicious taste! Learn more about sushi’s evolution as well as some of today’s most popular rolls with this infographic from Mizuumi Buffet.
Google+: What’s In It for Business
Google+ is more than just Google’s answer to Facebook. It’s no longer the “ghost town” many have perceived it to be, with over 500 million users. Plus, there are a myriad of benefits of Google+ for business. Check out this infographic to learn 7 benefits your business could be reaping from Google+.
Robert Griffin III’s Knee Injury
On Jan. 6, millions of NFL fans saw one of the most-talked-about – and most-cringe-worthy – knee injuries in sports history. During a 2013 wild-card playoff game against the Seattle Seahawks, rookie Washington Redskins quarterback Robert Griffin III fell to the turf after twisting his right knee. Diagnosis: Serious damage to Griffin’s anterior cruciate ligament (ACL), lateral collateral ligament (LCL) and medial meniscus.
What’s Driving Pay TV Growth in Europe?
Even though pay TV is declining in the Untied States, Europe is seeing a growth. So what exactly is creating this growth? Check out the infographic below presented by ClickSoftware to learn more about it.
Broken Unions: Divorce in the USA
An estimated one million divorces occur ever year. Seems like divorce is all around us these days. Not only are people getting divorced, but some people are actually afraid to get married because of divorce. Check out this infographic presented by InsuranceQuotes to learn more about divorce trends in the U.S.
Ignoring Heart Disease Won’t Lower Your Risk
Heart Disease is the number one cause of death in America. Each day an average of 2,200 people die from heart disease, while 56% of adults have been told by a health care professional to improve their health to lower their risk. Unfortunately, the vast majority of Americans are just not motivated to do anything about it. When the statistics show that 1 in 3 deaths in the United States are caused by heart disease, you have no other choice then to take this disease seriously before it is too late.
Nicotine – The Effects and Consequences
Nicotine is behind one of the most damaging habits in the United States: cigarette smoking. This addiction can have dire consequences not just for the user, but for those in close and frequent proximity to them. Approximately 1 in 4 teens become smokers, and 80% of those will continue to smoke into adulthood.
Motorcycle Theft – Don’t Become A Statistic
If you own a motorbike or are thinking about getting one then you need to take a look at this infographic, which shows you just how at risk you might be from having that expensive purchase stolen. Have a look at these statistics and make sure that you don’t become one.
Business Card Design Psychology
This infographic by CardPrinting.us is about how to design your business card in such a way that it will achieve aesthetic value and message clarity. With the help of a few basic principles of design, anyone who reads this infographic will be able to fine-tune the color combination, define character and personality as well as create subtle visual suggestion using whitespace in designing.
How To Control Your Dreams
Have you ever wanted to write a blockbuster novel, or star in a film with your favorite actor? Occasionally our dreams allow us to do this but for total control you need to learn how to practice lucid dreaming. With the following helpful suggestions, you might turn those hours spent sleeping into something more productive.
A Taste of History: Sushi Then and Now
There’s almost nothing like good sushi. Sushi’s fascinating history is only rivaled by its delicious taste! Learn more about sushi’s evolution as well as some of today’s most popular rolls with this infographic from Mizuumi Buffet.
Google+: What’s In It for Business
Google+ is more than just Google’s answer to Facebook. It’s no longer the “ghost town” many have perceived it to be, with over 500 million users. Plus, there are a myriad of benefits of Google+ for business. Check out this infographic to learn 7 benefits your business could be reaping from Google+.
Robert Griffin III’s Knee Injury
On Jan. 6, millions of NFL fans saw one of the most-talked-about – and most-cringe-worthy – knee injuries in sports history. During a 2013 wild-card playoff game against the Seattle Seahawks, rookie Washington Redskins quarterback Robert Griffin III fell to the turf after twisting his right knee. Diagnosis: Serious damage to Griffin’s anterior cruciate ligament (ACL), lateral collateral ligament (LCL) and medial meniscus.
Partners


Browse Archives By Category
Animated Infographics
Business Infographics
Career & Jobs Infographics
Education Infographics
Entertainment Industry Infographics
Environmental Infographics
Finance & Money Infographics
Food & Drink Infographics
Health Infographics
Historical Infographics
Home & Garden Infographics
Internet Infographics
Law and Legal Infographics
Lifestyle Infographics
Marketing Infographics
Offbeat Infographics
Parenting Infographics
Pets & Animals Infographics
Political Infographics
Shopping Infographics
Sports and Athletic Infographics
Technology Infographics
Transportation Infographics
Travel Infographics
Video Infographics