


Search 12,100+ Infographics!
Plastic Surgery Disasters: It Could Happen To You
Many of us will consider cosmetic surgery at some time to change or improve our appearance, but sometimes it goes wrong. Newspapers are full of ‘before’ and ‘after’ photos of people who have spent thousands trying to hold back time and failed. The following infographic from Accident-Compensation.co.uk lists some of the side effects that might make you think twice before parting with your hard-earned cash.
Car Safety Past, Present & Future
Over the years as car safety technology has seen major advances. With more and more drivers on the road each year it’s no wonder people have been striving to improve the safety of their cars. We have progressed in leaps and bounds in car safety and will continue to do so. The following infographic created by First4Lawyers shows how car safety has changed over the past 100 years, and how it looks set to change over the next few years.
Quick Tips for Obtaining a Trademark
Are you actively protecting your brand with a federal trademark registration? Obtaining a federal trademark on your business or brand name is serious business. Many try to register these on their own and often fail (been there, done that). The following infographic from GerbenLaw is a guide for successfully navigating through the process of registering a trademark with the U.S. Patent and Trademark Office.
Apple is Winning
Apple is building one of the most stunning financial runs in the history of corporate America. In the last five years over 365,000,000 devices have been sold. Not to mention they average $4 billion in monthly profit. Check out the infographic below to learn more about Apple’s financial success.
Green Guide For Small Businesses
Running a small business is difficult at the best of times and in a climate of an unstable economy, increasing supplier costs and an unpredictable energy market, prioritizing is vital to survival and success. It is with this in mind that business owners let issues such as running a more eco-friendly, or “green business” to one side, concentrating on the day to day issues any SME faces, rather than the short-term cost, long term gain that many green initiatives can produce.
The Art of Making Your Customers Love You
In order to create loyalty among your customers, your company must provide customer service that is superior to the competition. Companies that are successful and profitable always have loyal customers, and they’ve done so by delivering excellent customer service time and time again. NBRI has created the following infographic to help every company see the value in creating a customer service centric organization.
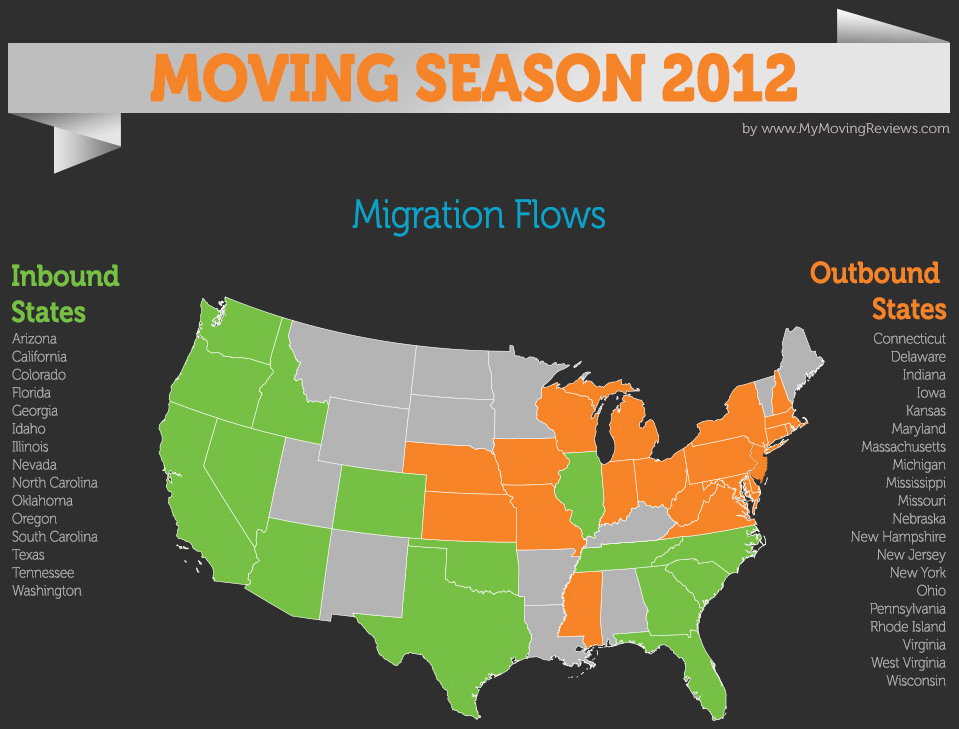
Moving Season 2012 Overview
The team behind MyMovingReviews.com has created the following infographic for all interested in the moving business and its nooks and crannies. Below you will see the Moving Season 2012 Infograph, which draws upon all of their data and analysis. We hope that you find the facts and numbers inside useful and enlightening.
Men’s Guide to Custom Suits
There’s nothing better than a perfectly designed custom suit. But it can be a daunting process to create your own suit from scratch. There are a lot of things you want to include to build the perfect suit, and there are a bunch of problems you want to avoid so the price doesn’t skyrocket. To help you create an awesome custom suit for many occasions, Alan David Custom Suits has created the ultimate men’s guide to custom suits.

The Job Round Up
This infographic introduces some creative, mysterious and surprisingly strange statistics relating to the jobs people choose to obtain. The figures and facts show the most loved and loathed jobs which includes danger and money motivated jobs people have.

Cheetahs: Nature’s Speed Machines
Did you know that cheetahs can accelerate from 0 to 60 MPH faster than a Ferarri? The amazing cheetah is the perfect example of natural specialization. They’re made for speed. Such a beautiful animal deserves a closer look as we will do in the following animated infographic.
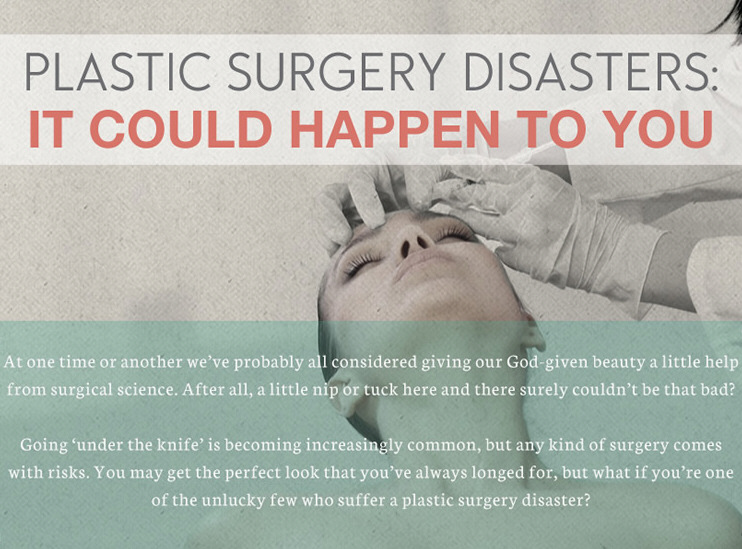
Plastic Surgery Disasters: It Could Happen To You
Many of us will consider cosmetic surgery at some time to change or improve our appearance, but sometimes it goes wrong. Newspapers are full of ‘before’ and ‘after’ photos of people who have spent thousands trying to hold back time and failed. The following infographic from Accident-Compensation.co.uk lists some of the side effects that might make you think twice before parting with your hard-earned cash.
Car Safety Past, Present & Future
Over the years as car safety technology has seen major advances. With more and more drivers on the road each year it’s no wonder people have been striving to improve the safety of their cars. We have progressed in leaps and bounds in car safety and will continue to do so. The following infographic created by First4Lawyers shows how car safety has changed over the past 100 years, and how it looks set to change over the next few years.
Quick Tips for Obtaining a Trademark
Are you actively protecting your brand with a federal trademark registration? Obtaining a federal trademark on your business or brand name is serious business. Many try to register these on their own and often fail (been there, done that). The following infographic from GerbenLaw is a guide for successfully navigating through the process of registering a trademark with the U.S. Patent and Trademark Office.
Apple is Winning
Apple is building one of the most stunning financial runs in the history of corporate America. In the last five years over 365,000,000 devices have been sold. Not to mention they average $4 billion in monthly profit. Check out the infographic below to learn more about Apple’s financial success.
Green Guide For Small Businesses
Running a small business is difficult at the best of times and in a climate of an unstable economy, increasing supplier costs and an unpredictable energy market, prioritizing is vital to survival and success. It is with this in mind that business owners let issues such as running a more eco-friendly, or “green business” to one side, concentrating on the day to day issues any SME faces, rather than the short-term cost, long term gain that many green initiatives can produce.
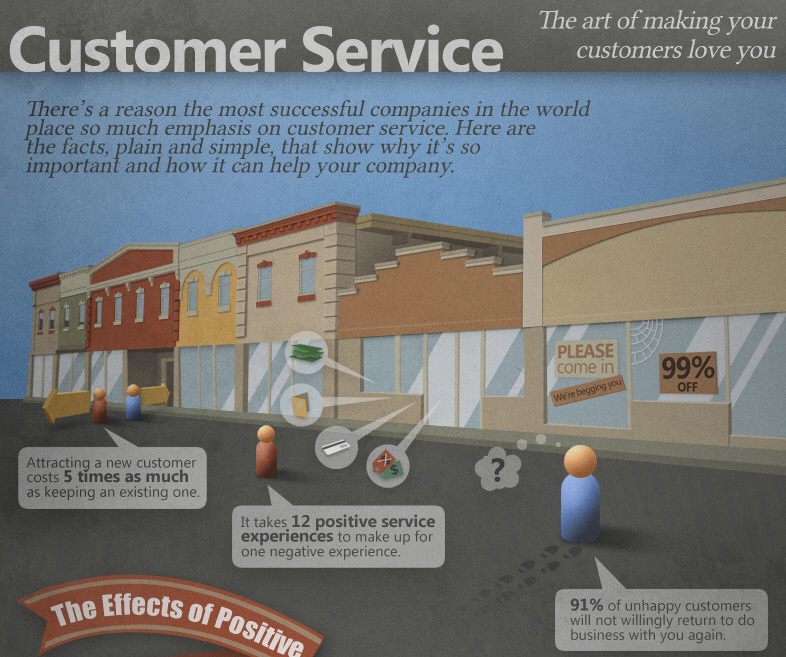
The Art of Making Your Customers Love You
In order to create loyalty among your customers, your company must provide customer service that is superior to the competition. Companies that are successful and profitable always have loyal customers, and they’ve done so by delivering excellent customer service time and time again. NBRI has created the following infographic to help every company see the value in creating a customer service centric organization.
Moving Season 2012 Overview
The team behind MyMovingReviews.com has created the following infographic for all interested in the moving business and its nooks and crannies. Below you will see the Moving Season 2012 Infograph, which draws upon all of their data and analysis. We hope that you find the facts and numbers inside useful and enlightening.
Men’s Guide to Custom Suits
There’s nothing better than a perfectly designed custom suit. But it can be a daunting process to create your own suit from scratch. There are a lot of things you want to include to build the perfect suit, and there are a bunch of problems you want to avoid so the price doesn’t skyrocket. To help you create an awesome custom suit for many occasions, Alan David Custom Suits has created the ultimate men’s guide to custom suits.
The Job Round Up
This infographic introduces some creative, mysterious and surprisingly strange statistics relating to the jobs people choose to obtain. The figures and facts show the most loved and loathed jobs which includes danger and money motivated jobs people have.
Cheetahs: Nature’s Speed Machines
Did you know that cheetahs can accelerate from 0 to 60 MPH faster than a Ferarri? The amazing cheetah is the perfect example of natural specialization. They’re made for speed. Such a beautiful animal deserves a closer look as we will do in the following animated infographic.
Partners


Browse Archives By Category
Animated Infographics
Business Infographics
Career & Jobs Infographics
Education Infographics
Entertainment Industry Infographics
Environmental Infographics
Finance & Money Infographics
Food & Drink Infographics
Health Infographics
Historical Infographics
Home & Garden Infographics
Internet Infographics
Law and Legal Infographics
Lifestyle Infographics
Marketing Infographics
Offbeat Infographics
Parenting Infographics
Pets & Animals Infographics
Political Infographics
Shopping Infographics
Sports and Athletic Infographics
Technology Infographics
Transportation Infographics
Travel Infographics
Video Infographics