


Search 12,100+ Infographics!
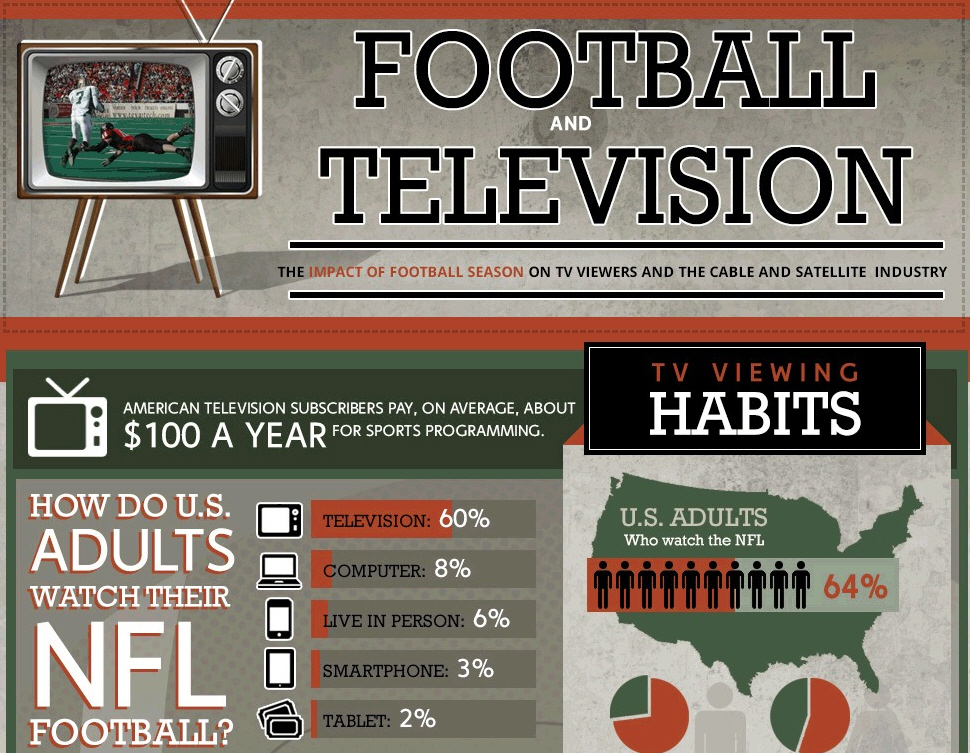
Football and Television
Many American’s anxiously await football season. Football has become a big part of our culture. However, during football season, cable and satellite providers get bombarded with customer service inquiries. This infographic presented by ClickSoftware provides a look at how Americans watch football as well as how cable and satellite companies are dealing with customer service.
The Techniques of the Best Tennis Players
In this infographic from the folks at TicketCity, learn how the world’s best tennis players win time and time again, then see them play live at the biggest tennis tournaments in the world.
Driving in Europe
This interactive infographic from Sixt attempts to simply and straightforwardly present all the complex rules and regulations surrounding driving across Europe in a clean, easy to understand format. It includes drunk driving laws, speed limits, items you’re legally required to have in the car, and some humorous observations about driving in each country.
Red Tape is Suffocating Our Children
Health and safety is intended to protect us and our loved ones from the dangers of day to day life. But, more and more we see health and safety regulations being interpreted all too literally. Issues arise because of these foolish “word of the law” interpretations.
Junk in the Trunk: Driver’s Roadside Preparedness
Finding yourself stranded in your car due to treacherous conditions like snow, ice, poor visibility and slick roads only to discover you have junk in the trunk, rather than the necessary roadside emergency supplies, can place you and your family in jeopardy. According to a new survey by State Farm® and KRC Research, more than 60 percent of drivers had some sort of “junk” (non-emergency supplies) in their trunk ranging from extra clothes and shoes to used food or drink containers. While 99 percent of drivers had at least one emergency supply in their vehicle, such as spare tire or jumper cables, a mere nine percent carried all the essential emergency roadside supplies.
The Evolution of The American Van
The van has made a tremendous impact on American society over the years. Have you ever wondered how the working van has evolved? Find out more about vans and how they have revolutionized in the United States on this infographic created by American Van.

Why Build Green?
Green building is smart building. Aside from their obvious benefit to the environment, green buildings deliver financial savings, are more comfortable, healthier, return higher productivity rates and have higher resale values. See this infographic for a quick look at why building green makes so much sense.

The Most Crucial Follows for SEO in 2013
Want to learn more about SEO and keep up with the latest developments, but don’t know who you should be following or who’s opinions are most valuable? Wildfire Digital has created the following infographic lists 32 of the top SEOs in the business.
Retail Social Media Top 10
Do you follow any of your favorite retailers on social media? Social media is quickly becoming the best way to get updates on your favorite brands. This infographic presented by Retail Customer Experience highlights the top 10 retailers in social media. Check it out...
Evolution of Business Presentation Technology
This infographic provides an in-depth account of the amazing progression of presentation technology over the past two centuries. From the blackboard in the early 19th century, to the Kodachrome 35mm slide film of the 30s, to the overhead transparency projects used in the 40s by the police and Army, to the release of PowerPoint in 1987 only for Macintosh (astonishing), to the myriad of cloud-based and mobile options available today today.
Football and Television
Many American’s anxiously await football season. Football has become a big part of our culture. However, during football season, cable and satellite providers get bombarded with customer service inquiries. This infographic presented by ClickSoftware provides a look at how Americans watch football as well as how cable and satellite companies are dealing with customer service.
The Techniques of the Best Tennis Players
In this infographic from the folks at TicketCity, learn how the world’s best tennis players win time and time again, then see them play live at the biggest tennis tournaments in the world.
Driving in Europe
This interactive infographic from Sixt attempts to simply and straightforwardly present all the complex rules and regulations surrounding driving across Europe in a clean, easy to understand format. It includes drunk driving laws, speed limits, items you’re legally required to have in the car, and some humorous observations about driving in each country.
Red Tape is Suffocating Our Children
Health and safety is intended to protect us and our loved ones from the dangers of day to day life. But, more and more we see health and safety regulations being interpreted all too literally. Issues arise because of these foolish “word of the law” interpretations.
Junk in the Trunk: Driver’s Roadside Preparedness
Finding yourself stranded in your car due to treacherous conditions like snow, ice, poor visibility and slick roads only to discover you have junk in the trunk, rather than the necessary roadside emergency supplies, can place you and your family in jeopardy. According to a new survey by State Farm® and KRC Research, more than 60 percent of drivers had some sort of “junk” (non-emergency supplies) in their trunk ranging from extra clothes and shoes to used food or drink containers. While 99 percent of drivers had at least one emergency supply in their vehicle, such as spare tire or jumper cables, a mere nine percent carried all the essential emergency roadside supplies.
The Evolution of The American Van
The van has made a tremendous impact on American society over the years. Have you ever wondered how the working van has evolved? Find out more about vans and how they have revolutionized in the United States on this infographic created by American Van.
Why Build Green?
Green building is smart building. Aside from their obvious benefit to the environment, green buildings deliver financial savings, are more comfortable, healthier, return higher productivity rates and have higher resale values. See this infographic for a quick look at why building green makes so much sense.
The Most Crucial Follows for SEO in 2013
Want to learn more about SEO and keep up with the latest developments, but don’t know who you should be following or who’s opinions are most valuable? Wildfire Digital has created the following infographic lists 32 of the top SEOs in the business.
Retail Social Media Top 10
Do you follow any of your favorite retailers on social media? Social media is quickly becoming the best way to get updates on your favorite brands. This infographic presented by Retail Customer Experience highlights the top 10 retailers in social media. Check it out...
Evolution of Business Presentation Technology
This infographic provides an in-depth account of the amazing progression of presentation technology over the past two centuries. From the blackboard in the early 19th century, to the Kodachrome 35mm slide film of the 30s, to the overhead transparency projects used in the 40s by the police and Army, to the release of PowerPoint in 1987 only for Macintosh (astonishing), to the myriad of cloud-based and mobile options available today today.
Partners


Browse Archives By Category
Animated Infographics
Business Infographics
Career & Jobs Infographics
Education Infographics
Entertainment Industry Infographics
Environmental Infographics
Finance & Money Infographics
Food & Drink Infographics
Health Infographics
Historical Infographics
Home & Garden Infographics
Internet Infographics
Law and Legal Infographics
Lifestyle Infographics
Marketing Infographics
Offbeat Infographics
Parenting Infographics
Pets & Animals Infographics
Political Infographics
Shopping Infographics
Sports and Athletic Infographics
Technology Infographics
Transportation Infographics
Travel Infographics
Video Infographics