


Search 12,100+ Infographics!
A History of Presidential Inaugurations
On January 20th, 2013, President Obama will be sworn in for his second term as the 44th President of the United States. Because January 20th falls on a Sunday this year, the ceremony for the public will take place on Monday, January 21st. In honor of this historic event, WyzAnt.com, a national marketplace of in home tutors, has created a visual overview of presidential inaugurations over the last 80 years including a summary of the state of the nation at the time each president was sworn into office.
The Hidden Value of Long Tail SEO
Long tail SEO is sometimes a lesser-known, yet incredibly powerful technique for building up ones organic search engine traffic. Research suggests that long tail keywords are easier to rank for, bring in more combined traffic, and convert more visitors to customers than head keywords. Learn more about the power of long tail SEO in the following infographic.
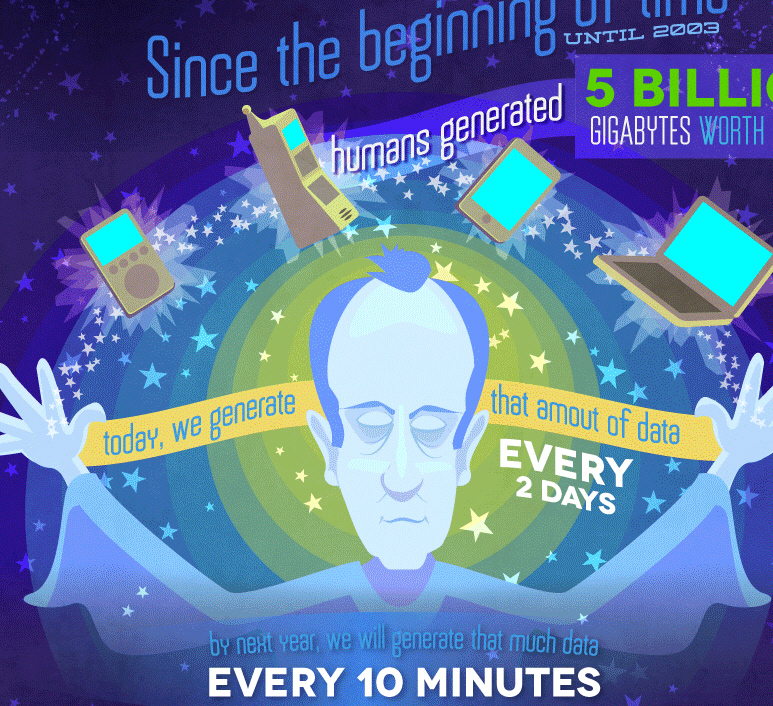
Data Footprints by Generations
Since the beginning of time up until 2003, humans generated five billion gigabytes worth of data. Today, we generate that amount of data in just two days! Not only do we generate a lot of data, it varies between generations. This infographic takes a look at data footprints by generation.

Sofa Reupholstery: Do-It-Yourself vs. Do-It-For-Me
If you feel like you can save money by doing furniture re-upholstery yourself, hold that thought and take a look at this infographic first. Not only does it lay out the pros and cons of DIY and DIFM, it also zooms in on the details, and reveals the hard truth behind every amateur or professional job.
Don’t Let the Bed Bugs Bite: Shocking Bed Bug Statistics and Facts
Bed bugs are incredibly resilient creatures—some can live up to 18 months without feeding. If there are bed bugs in your home, they’ll stick around until you hire a pest control professional. Learn more interesting facts about bed bugs with this infographic.

10 Tricks Insurance Companies May Use Following Car Accidents
BD&J Law Firm has developed the following infographic which illustrates just how much money some of the top insurance companies make in annual profits and exposes 10 common tricks and tactics insurance agents will use to get you to settle your claim for less money than it is really worth.
CES Trends 2013: What Will They Think of Next
CES is the worlds largest consumer technology tradeshow. It showcases all the new and upcoming technology. This infographic presented by BestChoiceReviews highlights the CES trends for 2013 as well as the winners in different categories for 2012. Check it out below to see what’s new in the tech world.
Biofuel – The New Wizard of Aus?
The race to produce a sustainable, scalable form of biofuel has become ‘wacky’ – literally. There are articles printed daily heralding the latest method of producing fuel, be it converting whiskey waste, recycling cooking oil or scooping algae from the ocean. Big Oil is ploughing millions each year into production and research – so why has an answer to our fuel needs not been found yet?
Understanding Prostate Cancer and Today’s Top Treatment Options
Have you heard of CyberKnife? This noninvasive cancer treatment option utilizes lasers to treat cancerous tissues and give the body the support it needs. Not only is this treatment safe, but it also results in a 93% disease-free survival rate after 5 years.
Bus WiFi and the Changing Face of Public Transportation
Mass transit WiFi availability is important to riders across the U.S. This infographic from SinglePoint Communications shows how bus WiFi availability impacts ridership, how public transportation systems have grown and the best cities for public transit.
A History of Presidential Inaugurations
On January 20th, 2013, President Obama will be sworn in for his second term as the 44th President of the United States. Because January 20th falls on a Sunday this year, the ceremony for the public will take place on Monday, January 21st. In honor of this historic event, WyzAnt.com, a national marketplace of in home tutors, has created a visual overview of presidential inaugurations over the last 80 years including a summary of the state of the nation at the time each president was sworn into office.
The Hidden Value of Long Tail SEO
Long tail SEO is sometimes a lesser-known, yet incredibly powerful technique for building up ones organic search engine traffic. Research suggests that long tail keywords are easier to rank for, bring in more combined traffic, and convert more visitors to customers than head keywords. Learn more about the power of long tail SEO in the following infographic.
Data Footprints by Generations
Since the beginning of time up until 2003, humans generated five billion gigabytes worth of data. Today, we generate that amount of data in just two days! Not only do we generate a lot of data, it varies between generations. This infographic takes a look at data footprints by generation.
Sofa Reupholstery: Do-It-Yourself vs. Do-It-For-Me
If you feel like you can save money by doing furniture re-upholstery yourself, hold that thought and take a look at this infographic first. Not only does it lay out the pros and cons of DIY and DIFM, it also zooms in on the details, and reveals the hard truth behind every amateur or professional job.
Don’t Let the Bed Bugs Bite: Shocking Bed Bug Statistics and Facts
Bed bugs are incredibly resilient creatures—some can live up to 18 months without feeding. If there are bed bugs in your home, they’ll stick around until you hire a pest control professional. Learn more interesting facts about bed bugs with this infographic.
10 Tricks Insurance Companies May Use Following Car Accidents
BD&J Law Firm has developed the following infographic which illustrates just how much money some of the top insurance companies make in annual profits and exposes 10 common tricks and tactics insurance agents will use to get you to settle your claim for less money than it is really worth.
CES Trends 2013: What Will They Think of Next
CES is the worlds largest consumer technology tradeshow. It showcases all the new and upcoming technology. This infographic presented by BestChoiceReviews highlights the CES trends for 2013 as well as the winners in different categories for 2012. Check it out below to see what’s new in the tech world.
Biofuel – The New Wizard of Aus?
The race to produce a sustainable, scalable form of biofuel has become ‘wacky’ – literally. There are articles printed daily heralding the latest method of producing fuel, be it converting whiskey waste, recycling cooking oil or scooping algae from the ocean. Big Oil is ploughing millions each year into production and research – so why has an answer to our fuel needs not been found yet?
Understanding Prostate Cancer and Today’s Top Treatment Options
Have you heard of CyberKnife? This noninvasive cancer treatment option utilizes lasers to treat cancerous tissues and give the body the support it needs. Not only is this treatment safe, but it also results in a 93% disease-free survival rate after 5 years.
Bus WiFi and the Changing Face of Public Transportation
Mass transit WiFi availability is important to riders across the U.S. This infographic from SinglePoint Communications shows how bus WiFi availability impacts ridership, how public transportation systems have grown and the best cities for public transit.
Partners


Browse Archives By Category
Animated Infographics
Business Infographics
Career & Jobs Infographics
Education Infographics
Entertainment Industry Infographics
Environmental Infographics
Finance & Money Infographics
Food & Drink Infographics
Health Infographics
Historical Infographics
Home & Garden Infographics
Internet Infographics
Law and Legal Infographics
Lifestyle Infographics
Marketing Infographics
Offbeat Infographics
Parenting Infographics
Pets & Animals Infographics
Political Infographics
Shopping Infographics
Sports and Athletic Infographics
Technology Infographics
Transportation Infographics
Travel Infographics
Video Infographics