


Search 12,100+ Infographics!
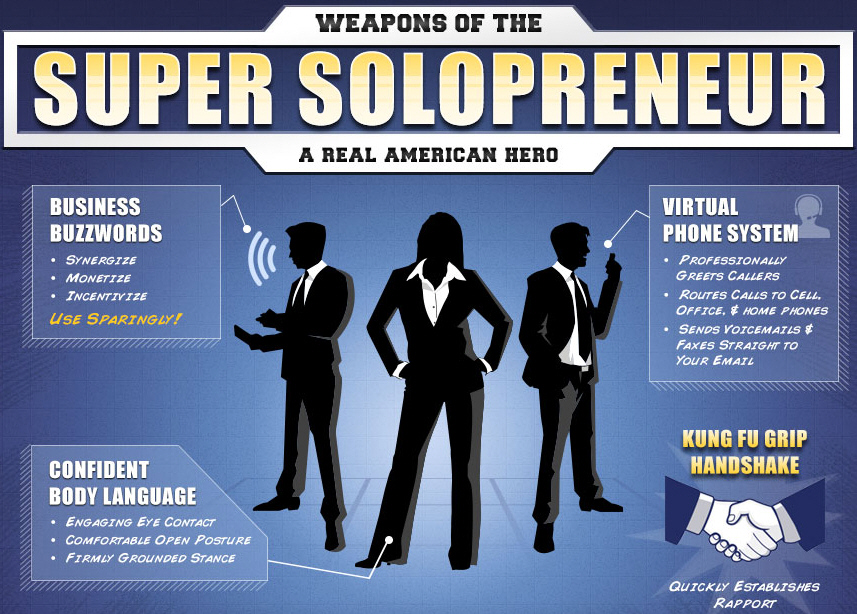
Weapons of the Super Solopreneur
Being a solo entrepreneur has its challenges. When Batman decided to “go solo” and start his own crime fighting business, he knew he needed the right gear to get the job done. The infographic below by UniTel Voice covers some of the must-have business weapons every super solopreneur needs in their arsenal. And the good news is you don’t need to be a billionaire like Bruce Wayne to utilize these powerful small business tools.
History of the Internet
Have you ever wondered about the history of the internet? From the very first virus to the birth of Google and beyond, this cool infographic from AVG.com covers all the important milestones.
Need a Safe?
Many people around the world from different countries are now making use of vaults and safes for their valuables safety. These item keepers are made from durable metals that are hardly destroyed by weather and other unexpected calamities that could happen. Considering these factors, there has been a forecast about the increase of demand for vaults this year. The increase of supply needed that was predicted by many businessmen is really big.
Modernization of the Ranch House Plan
Many homeowners appreciate the clean, elegant lines and integration of outdoor elements of the Mid-Century Modern house plan. This infographic shows how this futuristic style developed from the early ranch house plan.
What Does the Car of the Future Look Like?
Who actually enjoys getting up in the morning and driving to work? Most people don’t, so imagine that your car would do the driving, and you could use the free time to catch up on work, play a game on your iPhone, or whatever you please to do with your two free hands. Sounds great doesn’t it? Well, the idea isn’t too far off. Self-driving cars are in our near future and this infographic presented by InsuranceQuotes provides a deeper look into them.
Car Crash Checklist: Taking Action After an Auto Accident
Each year, nearly 11 million automobile accidents occur. Understanding how to protect yourself after an accident is important for both peace of mind and a speedy recovery. This infographic has some great information.
The Importance of Curb Appeal
In marketing, advertising plays a big part of making a sale and when marketing a commodity, it is undeniable that a big part of attracting customers is the visuals of that particular commodity. Selling a house is no different than selling other commodities since the sale of a house will no doubt rely on visual impact. Immediate visual appeal in terms of what the house looks like on the outside is therefore important.
A Guide to Unique Baby Gifts Based on Parenting Styles
Ever noticed how whenever you’re shopping for a friend or a relative’s newborn baby, you always keep the parent’s lifestyle in mind? That’s because we know how vital they are to their children’s lives and we want to help them as best as we can during this stage of their family’s life. Whether you know people who are new to the parenting world or couples who are already experienced in raising a bunch of kids, this infographic can definitely help you find the perfect presents to give to their young ones.
A Look at Lower Back Pain: Commonality, Causes, Conditions, and Care
The common cold may be the most common reason for doctor visits, but back pain comes in at a close second. If you are one of those that is tired of dealing with chronic back pain, then you might consider orthopedic surgery as an option. Learn more in the following infographic.
Bursting at the Seams: Stop Pipes From Bursting
With the weather turning from bad to worse frozen pipes and flooding are two continuous threats. This infographic from Premierline Direct highlights some simple, yet, effective tips to help prevent your pipes from bursting.
Partners


Browse Archives By Category
Animated Infographics
Business Infographics
Career & Jobs Infographics
Education Infographics
Entertainment Industry Infographics
Environmental Infographics
Finance & Money Infographics
Food & Drink Infographics
Health Infographics
Historical Infographics
Home & Garden Infographics
Internet Infographics
Law and Legal Infographics
Lifestyle Infographics
Marketing Infographics
Offbeat Infographics
Parenting Infographics
Pets & Animals Infographics
Political Infographics
Shopping Infographics
Sports and Athletic Infographics
Technology Infographics
Transportation Infographics
Travel Infographics
Video Infographics