


Search 12,100+ Infographics!
How To Transport Pets
Moving your pet it’s never easy, and that’s why we believe you need peace of mind. Find more information about how you can save money, time and prevent stress when moving your dog, cat or even horse with the following infographic from uShip.
The State of Infographics
Did you know that an infographic has the potential to reach up to 15 million people? When infographics are done correctly they can be a great marketing tool. Check out the infographic below to learn about the current state of infographics.
Effective Internet Marketing
This infographic from Shebang details the prevailing trends for for effective online marketing, with some strong numbers to support each channel. It is interesting to note that 89% of marketers say that they are maintaining or increasing their budgets that focus on these trends.
Hide Yo’ Kids, Hide Yo’ Wife & Your Husband Too
If you live in the suburbs you might think you are less likely to get burglarized, unfortunately that’s not the case. Homes in the suburbs are 1.5 times more likely to be broken into. So how do you protect your home and family from a break-in? You think like a burglar. Knowing what burglars are looking for and how they break-in can help you safe guard your home.
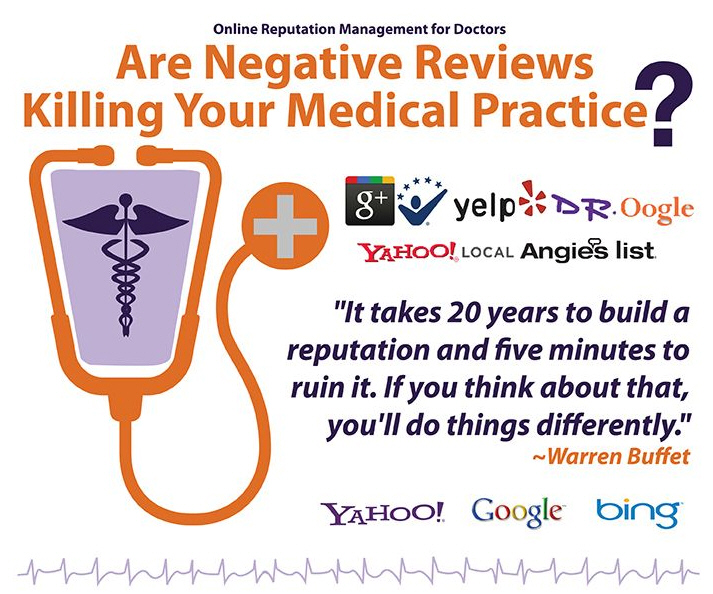
Are Negative Reviews Killing Your Medical Practice?
Understanding the impact the web has on everyday life, James Dreesen, CEO of Get New Patients, INC. reaches out to the vulnerability of the medical professional in the age of the world wide web. The exposure we all face is magnified when it pertains to our livelihood. The doctor, who gets an unfair or false review from a disgruntled employee or unscrupulous competitor can suffer financially.
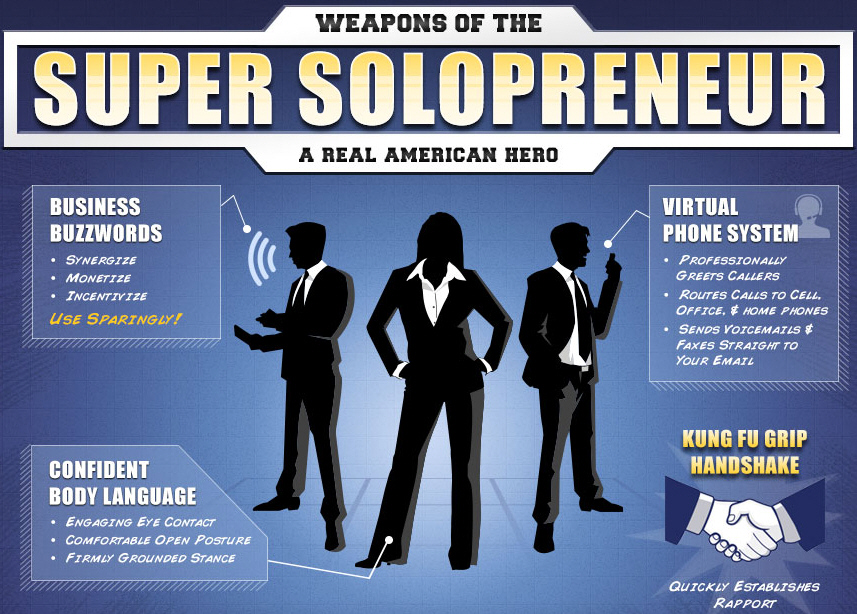
Weapons of the Super Solopreneur
Being a solo entrepreneur has its challenges. When Batman decided to “go solo” and start his own crime fighting business, he knew he needed the right gear to get the job done. The infographic below by UniTel Voice covers some of the must-have business weapons every super solopreneur needs in their arsenal. And the good news is you don’t need to be a billionaire like Bruce Wayne to utilize these powerful small business tools.
History of the Internet
Have you ever wondered about the history of the internet? From the very first virus to the birth of Google and beyond, this cool infographic from AVG.com covers all the important milestones.
Need a Safe?
Many people around the world from different countries are now making use of vaults and safes for their valuables safety. These item keepers are made from durable metals that are hardly destroyed by weather and other unexpected calamities that could happen. Considering these factors, there has been a forecast about the increase of demand for vaults this year. The increase of supply needed that was predicted by many businessmen is really big.
Modernization of the Ranch House Plan
Many homeowners appreciate the clean, elegant lines and integration of outdoor elements of the Mid-Century Modern house plan. This infographic shows how this futuristic style developed from the early ranch house plan.
What Does the Car of the Future Look Like?
Who actually enjoys getting up in the morning and driving to work? Most people don’t, so imagine that your car would do the driving, and you could use the free time to catch up on work, play a game on your iPhone, or whatever you please to do with your two free hands. Sounds great doesn’t it? Well, the idea isn’t too far off. Self-driving cars are in our near future and this infographic presented by InsuranceQuotes provides a deeper look into them.
How To Transport Pets
Moving your pet it’s never easy, and that’s why we believe you need peace of mind. Find more information about how you can save money, time and prevent stress when moving your dog, cat or even horse with the following infographic from uShip.
The State of Infographics
Did you know that an infographic has the potential to reach up to 15 million people? When infographics are done correctly they can be a great marketing tool. Check out the infographic below to learn about the current state of infographics.
Effective Internet Marketing
This infographic from Shebang details the prevailing trends for for effective online marketing, with some strong numbers to support each channel. It is interesting to note that 89% of marketers say that they are maintaining or increasing their budgets that focus on these trends.
Hide Yo’ Kids, Hide Yo’ Wife & Your Husband Too
If you live in the suburbs you might think you are less likely to get burglarized, unfortunately that’s not the case. Homes in the suburbs are 1.5 times more likely to be broken into. So how do you protect your home and family from a break-in? You think like a burglar. Knowing what burglars are looking for and how they break-in can help you safe guard your home.
Are Negative Reviews Killing Your Medical Practice?
Understanding the impact the web has on everyday life, James Dreesen, CEO of Get New Patients, INC. reaches out to the vulnerability of the medical professional in the age of the world wide web. The exposure we all face is magnified when it pertains to our livelihood. The doctor, who gets an unfair or false review from a disgruntled employee or unscrupulous competitor can suffer financially.
Weapons of the Super Solopreneur
Being a solo entrepreneur has its challenges. When Batman decided to “go solo” and start his own crime fighting business, he knew he needed the right gear to get the job done. The infographic below by UniTel Voice covers some of the must-have business weapons every super solopreneur needs in their arsenal. And the good news is you don’t need to be a billionaire like Bruce Wayne to utilize these powerful small business tools.
History of the Internet
Have you ever wondered about the history of the internet? From the very first virus to the birth of Google and beyond, this cool infographic from AVG.com covers all the important milestones.
Need a Safe?
Many people around the world from different countries are now making use of vaults and safes for their valuables safety. These item keepers are made from durable metals that are hardly destroyed by weather and other unexpected calamities that could happen. Considering these factors, there has been a forecast about the increase of demand for vaults this year. The increase of supply needed that was predicted by many businessmen is really big.
Modernization of the Ranch House Plan
Many homeowners appreciate the clean, elegant lines and integration of outdoor elements of the Mid-Century Modern house plan. This infographic shows how this futuristic style developed from the early ranch house plan.
What Does the Car of the Future Look Like?
Who actually enjoys getting up in the morning and driving to work? Most people don’t, so imagine that your car would do the driving, and you could use the free time to catch up on work, play a game on your iPhone, or whatever you please to do with your two free hands. Sounds great doesn’t it? Well, the idea isn’t too far off. Self-driving cars are in our near future and this infographic presented by InsuranceQuotes provides a deeper look into them.
Partners


Browse Archives By Category
Animated Infographics
Business Infographics
Career & Jobs Infographics
Education Infographics
Entertainment Industry Infographics
Environmental Infographics
Finance & Money Infographics
Food & Drink Infographics
Health Infographics
Historical Infographics
Home & Garden Infographics
Internet Infographics
Law and Legal Infographics
Lifestyle Infographics
Marketing Infographics
Offbeat Infographics
Parenting Infographics
Pets & Animals Infographics
Political Infographics
Shopping Infographics
Sports and Athletic Infographics
Technology Infographics
Transportation Infographics
Travel Infographics
Video Infographics