


Search 12,100+ Infographics!

Do Your Applicants Belong on the Naughty or Nice List?
It can be difficult to find the right people for your company’s open jobs. How will you know if the candidate is top talent or could be the office Grinch? The infographic below, compiled by Spark Hire, an online video resume and interviewing platform, provides a helpful quiz to let you know if your holiday candidate is a gift or a curse.
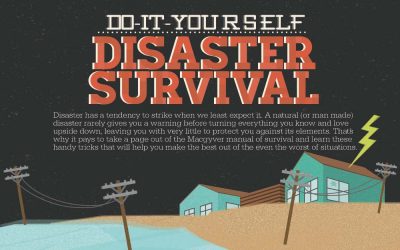
DIY Disaster Survival
Disaster has a tendency to strike when we least expect it. A natural (or man made) disaster rarely gives you a warning before turning everything you know and love upside down, leaving you with very little to protect you against its elements. That’s why it pays to take a page out of the Macgyver manual of survival and learn these handy tricks that will help you make the best out of the even the worst of situations.
Unintentional Injury Deaths
In 2010, 118,043 people died as a result of an unintentional injury, making it the 5th leading cause of death in the United States. Get the facts and learn how you can protect yourself from personal injury in the following infographic from Total Injury.
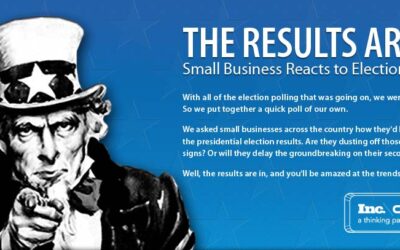
Small Business Reacts to 2012 Election Results
Cargo asked small businesses across the country how they’d be impacted by the presidential election results. Are they dusting off those “Help Wanted” signs? Or will they delay the groundbreaking on their second location? Well, the results are in, and you’ll be amazed at the trends that were discovered.
Christmas Crackers
Just in time for Christmas, Barker and Stonehouse has put together the following infographic which includes some weird and wonderful facts about Christmas dinners’ throughout the ages.
Tis The Season for DUIs
In December 2010, alcohol-related car accidents caused an average of 25 deaths per day, accounting for 30% of all motor vehicle accidents that month. New Year’s Day has been found to be the deadliest day of the year for drunk driving deaths. In this infographic from Total DUI, you’ll learn how to avoid a DUI arrest this season.
The Science of Bonking
Bonking, or Тhitting-the-wallУ is a feeling that athletes get when their bodyХs energy levels are depleted. Bonking results in nausea, cramping, fatigue, and usually a really bad rest of the day. The great thing is that with a little bit of science, bonking can be curbed or totally eliminated from your next long bike ride, run, or other endurance event. This infographic from Bonkkit shows you how to avoid the hurt in your next event.
Technology Behind Enhanced 911
When you dial 9-1-1, you’re immediately connected to an emergency dispatch where they pinpoint your location and direct the emergency resources your way. While you may be flustered or disgruntled in your emergency, the technology behind enhanced 9-1-1 calls will transmit valuable information to the dispatcher known as PSAP or Public Safety Answering Point. The technology behind enhanced 9-1-1 is extraordinary and in many situations, can save you from disastrous mishaps.
Redefining Christmas Traditions With Artificial Christmas Trees
Every Christmas tradition begins somewhere, and those of us who follow Christmas tree trends know that more and more families are building their holiday traditions around artificial Christmas trees. Find out who’s buying artificial, where they live, and why more and more people are choosing artificial in Tree Classics’ infographic of real vs fake artificial Christmas tree facts.
Christmas – The Most Engaging Time of the Year
Christmas is one of most popular days of the year to get engaged as people want it to be extra special. Take a look at this infographic. Some of the wedding statistics are quite surprising.
Do Your Applicants Belong on the Naughty or Nice List?
It can be difficult to find the right people for your company’s open jobs. How will you know if the candidate is top talent or could be the office Grinch? The infographic below, compiled by Spark Hire, an online video resume and interviewing platform, provides a helpful quiz to let you know if your holiday candidate is a gift or a curse.
DIY Disaster Survival
Disaster has a tendency to strike when we least expect it. A natural (or man made) disaster rarely gives you a warning before turning everything you know and love upside down, leaving you with very little to protect you against its elements. That’s why it pays to take a page out of the Macgyver manual of survival and learn these handy tricks that will help you make the best out of the even the worst of situations.
Unintentional Injury Deaths
In 2010, 118,043 people died as a result of an unintentional injury, making it the 5th leading cause of death in the United States. Get the facts and learn how you can protect yourself from personal injury in the following infographic from Total Injury.
Small Business Reacts to 2012 Election Results
Cargo asked small businesses across the country how they’d be impacted by the presidential election results. Are they dusting off those “Help Wanted” signs? Or will they delay the groundbreaking on their second location? Well, the results are in, and you’ll be amazed at the trends that were discovered.
Christmas Crackers
Just in time for Christmas, Barker and Stonehouse has put together the following infographic which includes some weird and wonderful facts about Christmas dinners’ throughout the ages.
Tis The Season for DUIs
In December 2010, alcohol-related car accidents caused an average of 25 deaths per day, accounting for 30% of all motor vehicle accidents that month. New Year’s Day has been found to be the deadliest day of the year for drunk driving deaths. In this infographic from Total DUI, you’ll learn how to avoid a DUI arrest this season.
The Science of Bonking
Bonking, or Тhitting-the-wallУ is a feeling that athletes get when their bodyХs energy levels are depleted. Bonking results in nausea, cramping, fatigue, and usually a really bad rest of the day. The great thing is that with a little bit of science, bonking can be curbed or totally eliminated from your next long bike ride, run, or other endurance event. This infographic from Bonkkit shows you how to avoid the hurt in your next event.
Technology Behind Enhanced 911
When you dial 9-1-1, you’re immediately connected to an emergency dispatch where they pinpoint your location and direct the emergency resources your way. While you may be flustered or disgruntled in your emergency, the technology behind enhanced 9-1-1 calls will transmit valuable information to the dispatcher known as PSAP or Public Safety Answering Point. The technology behind enhanced 9-1-1 is extraordinary and in many situations, can save you from disastrous mishaps.
Redefining Christmas Traditions With Artificial Christmas Trees
Every Christmas tradition begins somewhere, and those of us who follow Christmas tree trends know that more and more families are building their holiday traditions around artificial Christmas trees. Find out who’s buying artificial, where they live, and why more and more people are choosing artificial in Tree Classics’ infographic of real vs fake artificial Christmas tree facts.
Christmas – The Most Engaging Time of the Year
Christmas is one of most popular days of the year to get engaged as people want it to be extra special. Take a look at this infographic. Some of the wedding statistics are quite surprising.
Partners


Browse Archives By Category
Animated Infographics
Business Infographics
Career & Jobs Infographics
Education Infographics
Entertainment Industry Infographics
Environmental Infographics
Finance & Money Infographics
Food & Drink Infographics
Health Infographics
Historical Infographics
Home & Garden Infographics
Internet Infographics
Law and Legal Infographics
Lifestyle Infographics
Marketing Infographics
Offbeat Infographics
Parenting Infographics
Pets & Animals Infographics
Political Infographics
Shopping Infographics
Sports and Athletic Infographics
Technology Infographics
Transportation Infographics
Travel Infographics
Video Infographics