


Search 12,100+ Infographics!
Diapers – Cloth or Disposables?
In the following infographic, discover the reasons you should consider cloth diapers as an option for your child and your family.

Gangnam Style: The Rise of K-Pop
Gangnam Style just defines the rise of k-pop, and this time has galloped into the US, hurdling over record and record. Psy’s look at the wealth gap in Seoul, South Korea could be over looked by the flashiness and freshness of his musical video, but “Gangnam Style” is more than just an inspirational way of life.
Cyber Monday in Perspective
Cyber Monday 2012 was the largest single day of online sales in history, coming in at $1.98 Billion according to Adobe’s Digital Index. In fact if you combine the online sales of Cyber Monday with those from Black Friday 2012 you get an immense $3.28 Billion or more than the annual profit of Coca-Cola, CBS, JC Penny, Radio Shack, Southwest Airlines, Xerox and Petsmart – COMBINED!
Top Travel Friendly Facilities For Nurses
Travel nursing offers an exciting opportunity to build your career and add rich experiences to your life. Some ten thousand nurses decide to travel to hospitals and medical facilities outside their communities every week. Check out the most friendly facilities for nurses below in an infographic published by Soliant Health.
Is America’s Vision 20/20?
If you are experiencing blurry or double vision, seeing halos around lights, or squinting more than normal, you might need new eyeglasses. Check out this infographic to learn how to properly care for your eyes.
Evolution of Luggage
Today’s luggage options offer all kinds of sizes, shapes and accessories. But, have you ever stop to consider how it’s evolved over time to shape our needs? Going back to the 1100s through the present day (and beyond!), luggage is continually changing, in step with our lives. Learn more about how luggage has evolved over time in this infographic from Expedia.

Using Tax Free 529 Plans To Save For College
Saving for college is not easy, especially the case if you have more than one child. Many families are now choosing to use 529 college savings plans with tax-free earnings, which can be used for tuition and other qualified higher education expenses.
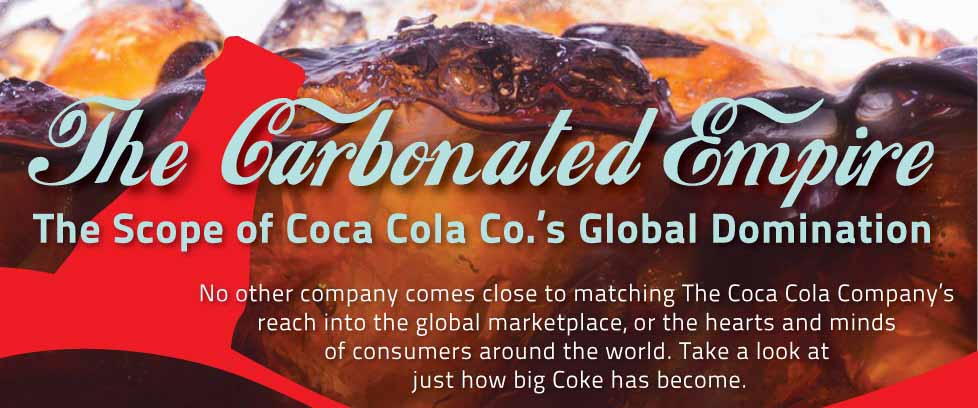
The Carbonated Empire: The Scope of Coca Cola Global Domination
No other company comes close to matching The Coca Cola Company’s reach into the global marketplace, or the hearts and minds of consumers around the world. In the following infographic by Top Management Degrees, take a look at just how big Coke has become.
Horoscope for 2013 Year
Discover at a glance what the future might hold for you, and explore what avenues might be worth exploring. This infographic is designed to provide a quick glance into your future – whether it be good/bad, happy/unhappy, or something else.
The Future of TV
In the following infographic by Beenius, learn more about the advanced interactive TV technology available for TV providers globally.
Diapers – Cloth or Disposables?
In the following infographic, discover the reasons you should consider cloth diapers as an option for your child and your family.
Gangnam Style: The Rise of K-Pop
Gangnam Style just defines the rise of k-pop, and this time has galloped into the US, hurdling over record and record. Psy’s look at the wealth gap in Seoul, South Korea could be over looked by the flashiness and freshness of his musical video, but “Gangnam Style” is more than just an inspirational way of life.
Cyber Monday in Perspective
Cyber Monday 2012 was the largest single day of online sales in history, coming in at $1.98 Billion according to Adobe’s Digital Index. In fact if you combine the online sales of Cyber Monday with those from Black Friday 2012 you get an immense $3.28 Billion or more than the annual profit of Coca-Cola, CBS, JC Penny, Radio Shack, Southwest Airlines, Xerox and Petsmart – COMBINED!
Top Travel Friendly Facilities For Nurses
Travel nursing offers an exciting opportunity to build your career and add rich experiences to your life. Some ten thousand nurses decide to travel to hospitals and medical facilities outside their communities every week. Check out the most friendly facilities for nurses below in an infographic published by Soliant Health.
Is America’s Vision 20/20?
If you are experiencing blurry or double vision, seeing halos around lights, or squinting more than normal, you might need new eyeglasses. Check out this infographic to learn how to properly care for your eyes.
Evolution of Luggage
Today’s luggage options offer all kinds of sizes, shapes and accessories. But, have you ever stop to consider how it’s evolved over time to shape our needs? Going back to the 1100s through the present day (and beyond!), luggage is continually changing, in step with our lives. Learn more about how luggage has evolved over time in this infographic from Expedia.
Using Tax Free 529 Plans To Save For College
Saving for college is not easy, especially the case if you have more than one child. Many families are now choosing to use 529 college savings plans with tax-free earnings, which can be used for tuition and other qualified higher education expenses.
The Carbonated Empire: The Scope of Coca Cola Global Domination
No other company comes close to matching The Coca Cola Company’s reach into the global marketplace, or the hearts and minds of consumers around the world. In the following infographic by Top Management Degrees, take a look at just how big Coke has become.
Horoscope for 2013 Year
Discover at a glance what the future might hold for you, and explore what avenues might be worth exploring. This infographic is designed to provide a quick glance into your future – whether it be good/bad, happy/unhappy, or something else.
The Future of TV
In the following infographic by Beenius, learn more about the advanced interactive TV technology available for TV providers globally.
Partners


Browse Archives By Category
Animated Infographics
Business Infographics
Career & Jobs Infographics
Education Infographics
Entertainment Industry Infographics
Environmental Infographics
Finance & Money Infographics
Food & Drink Infographics
Health Infographics
Historical Infographics
Home & Garden Infographics
Internet Infographics
Law and Legal Infographics
Lifestyle Infographics
Marketing Infographics
Offbeat Infographics
Parenting Infographics
Pets & Animals Infographics
Political Infographics
Shopping Infographics
Sports and Athletic Infographics
Technology Infographics
Transportation Infographics
Travel Infographics
Video Infographics