


Search 12,100+ Infographics!
What Makes A Travel Writer
With 2012 coming to an end, it is the time of year where we all sit back and reflect on what we have achieved and what we haven’t. Entering 2013 many of us will have decided to make new year resolutions and have every intention of keeping them. One of the most common is to travel more. But with the worlds economy as it is how can the vast majority of us do this?
Do My Pets Really Need Vaccinations?
Today’s pets have it all: obedience classes, grooming salons, daycare centers, and their very own hotels! However, most of these places will only accept pets that are up-to-date on their vaccinations. Check out this infographic from to see if your pet needs a trip to the vet.
Visual Gold! The New Revolution of Content Marketing
The future of content marketing is found in visual content; infographics, photos, videos, memes, and other engaging content that captivates a viewer. For proof, check out the infographic below from the team at Marketo and learn how you too can build your content marketing campaign into a solid structure of visual gold.
Philadelphia Food and Restaurant Guide
Philadelphia has become a foodie hot spot in recent years. Check out this Philly Food Guide from EZmini.com to learn about some of the top restaurants to eat at when in Philly. It offers hand-picked suggestions on what to order, and what is special at each restaurant or food truck.
Why YouTube Marketing is Important
Every month 22,000 people search for the term “YouTube Marketing” because YouTube is easy to work with and it has proved to bring tangible results. Check out this infographic for information about using YouTube for branding and SEO.
Heel Pain? A Plantar Fasciitis Guide
Obese individuals may have to deal with a number of health problems, including foot pain. In fact, overweight people have a 140% greater chance of developing plantar fasciitis. Learn about the symptoms of plantar fasciitis in this infographic.
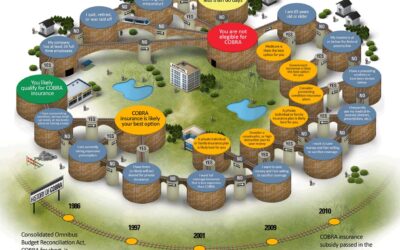
Is COBRA Insurance Right For You?
The following is a “choose your own adventure” interactive infographic to help you understand COBRA insurance and whether or not it is the right choice for you after job loss.

What Makes Workers Happy? Optimizing Your Office Space
Do the temperature, paint choices, and office layout of your commercial real estate space affect how well your employees are able to work in the office? Find out why almost half of all workers think their work would improve in a better office environment in this infographic.

Crib to College – Where Does the Money Go?
In the following infographic, designed by California Cryobank , take a trip back to 1960 to see how much it cost to raise a child 5 decades ago. Compare it to the cost of raising a child in 2011, and you may just be surprised at what you find.
How Much Do Americans Spend Over Christmas?
In this infographic by FunSherpa see some interesting facts on how much do Americans spend over Christmas. The average family budget for Christmas in 2012 is $749.51. That’s up over from the $740.57 that an average family spent last year. Early Shoppers spend 14% more than the average shopper.
What Makes A Travel Writer
With 2012 coming to an end, it is the time of year where we all sit back and reflect on what we have achieved and what we haven’t. Entering 2013 many of us will have decided to make new year resolutions and have every intention of keeping them. One of the most common is to travel more. But with the worlds economy as it is how can the vast majority of us do this?
Do My Pets Really Need Vaccinations?
Today’s pets have it all: obedience classes, grooming salons, daycare centers, and their very own hotels! However, most of these places will only accept pets that are up-to-date on their vaccinations. Check out this infographic from to see if your pet needs a trip to the vet.
Visual Gold! The New Revolution of Content Marketing
The future of content marketing is found in visual content; infographics, photos, videos, memes, and other engaging content that captivates a viewer. For proof, check out the infographic below from the team at Marketo and learn how you too can build your content marketing campaign into a solid structure of visual gold.
Philadelphia Food and Restaurant Guide
Philadelphia has become a foodie hot spot in recent years. Check out this Philly Food Guide from EZmini.com to learn about some of the top restaurants to eat at when in Philly. It offers hand-picked suggestions on what to order, and what is special at each restaurant or food truck.
Why YouTube Marketing is Important
Every month 22,000 people search for the term “YouTube Marketing” because YouTube is easy to work with and it has proved to bring tangible results. Check out this infographic for information about using YouTube for branding and SEO.
Heel Pain? A Plantar Fasciitis Guide
Obese individuals may have to deal with a number of health problems, including foot pain. In fact, overweight people have a 140% greater chance of developing plantar fasciitis. Learn about the symptoms of plantar fasciitis in this infographic.
Is COBRA Insurance Right For You?
The following is a “choose your own adventure” interactive infographic to help you understand COBRA insurance and whether or not it is the right choice for you after job loss.
What Makes Workers Happy? Optimizing Your Office Space
Do the temperature, paint choices, and office layout of your commercial real estate space affect how well your employees are able to work in the office? Find out why almost half of all workers think their work would improve in a better office environment in this infographic.
Crib to College – Where Does the Money Go?
In the following infographic, designed by California Cryobank , take a trip back to 1960 to see how much it cost to raise a child 5 decades ago. Compare it to the cost of raising a child in 2011, and you may just be surprised at what you find.
How Much Do Americans Spend Over Christmas?
In this infographic by FunSherpa see some interesting facts on how much do Americans spend over Christmas. The average family budget for Christmas in 2012 is $749.51. That’s up over from the $740.57 that an average family spent last year. Early Shoppers spend 14% more than the average shopper.
Partners


Browse Archives By Category
Animated Infographics
Business Infographics
Career & Jobs Infographics
Education Infographics
Entertainment Industry Infographics
Environmental Infographics
Finance & Money Infographics
Food & Drink Infographics
Health Infographics
Historical Infographics
Home & Garden Infographics
Internet Infographics
Law and Legal Infographics
Lifestyle Infographics
Marketing Infographics
Offbeat Infographics
Parenting Infographics
Pets & Animals Infographics
Political Infographics
Shopping Infographics
Sports and Athletic Infographics
Technology Infographics
Transportation Infographics
Travel Infographics
Video Infographics