


Search 12,100+ Infographics!
100 Years of Women’s Fashion
Fashion trends are constantly in flux. What’s here today…is gone in about five minutes. And sometimes, what everybody was wearing twenty years ago can return in the blink of an eye. (We’re looking at you, ‘80s.) But fashion isn’t nearly as random as you may think. There’s a strong thread of history running through everything you wear.
History of Christmas Traditions
Across the world, Christmas is celebrated in a multitude of rich and cherished traditions. Their origins are wonderfully varied, emerging out of cultures and beliefs throughout history. This illustrated timeline, brought to you by Balsam Hill, captures the flow of some of the most popular Christmas traditions and figures and traces their simple lineage from St. Nicholas’ humble beginnings to today.
Infographics: 10 Things You Need To Know
The following infographic from Kevin Akers design + imagery is list of top ten things everyone should know about the new marketing phenomenon clarifies how to create interesting, noteworthy infographics.
If Children Ran Christmas…
Part of the magic of Christmas is seeing the day through a child’s eyes. So, Santa asked 500 children in the UK aged six to 10 what they would do if they were in charge of Christmas, and what they love about it. Whether they wanted to visit him in his home in Santa’s Lapland, give presents to all children that are poor and hungry or just eat more cheese, the results are sweet, funny and heart-warming.
It’s Time To Go Mobile
According to MobiThinking®, at the end of 2011, there were 6 billion mobile subscribers worldwide. That’s 87% of the world’s population! It’s been estimated that by the end of 2016, there will be 8 billion mobile subscribers. That means there is a mobile phone or device for nearly every person on the planet, accessing the Internet.
Holiday Shopping Online Trends
The following is a visual depiction of anticipated holiday shopping via the internet for the 2012 holiday season. The infographic Velaro by shows shopping trends based on age, gender, geography, and annual income.
Maximizing Your Dollars on Cyber Monday
Are you a Black Friday fanatic or bargain hunter that hates the crowd? More and more, consumers are turning to the Internet, mobile apps and e-coupons to stretch holiday dollars. Cyber Monday is the secret for holiday savings — are you in the know? Find out with the following infographic.
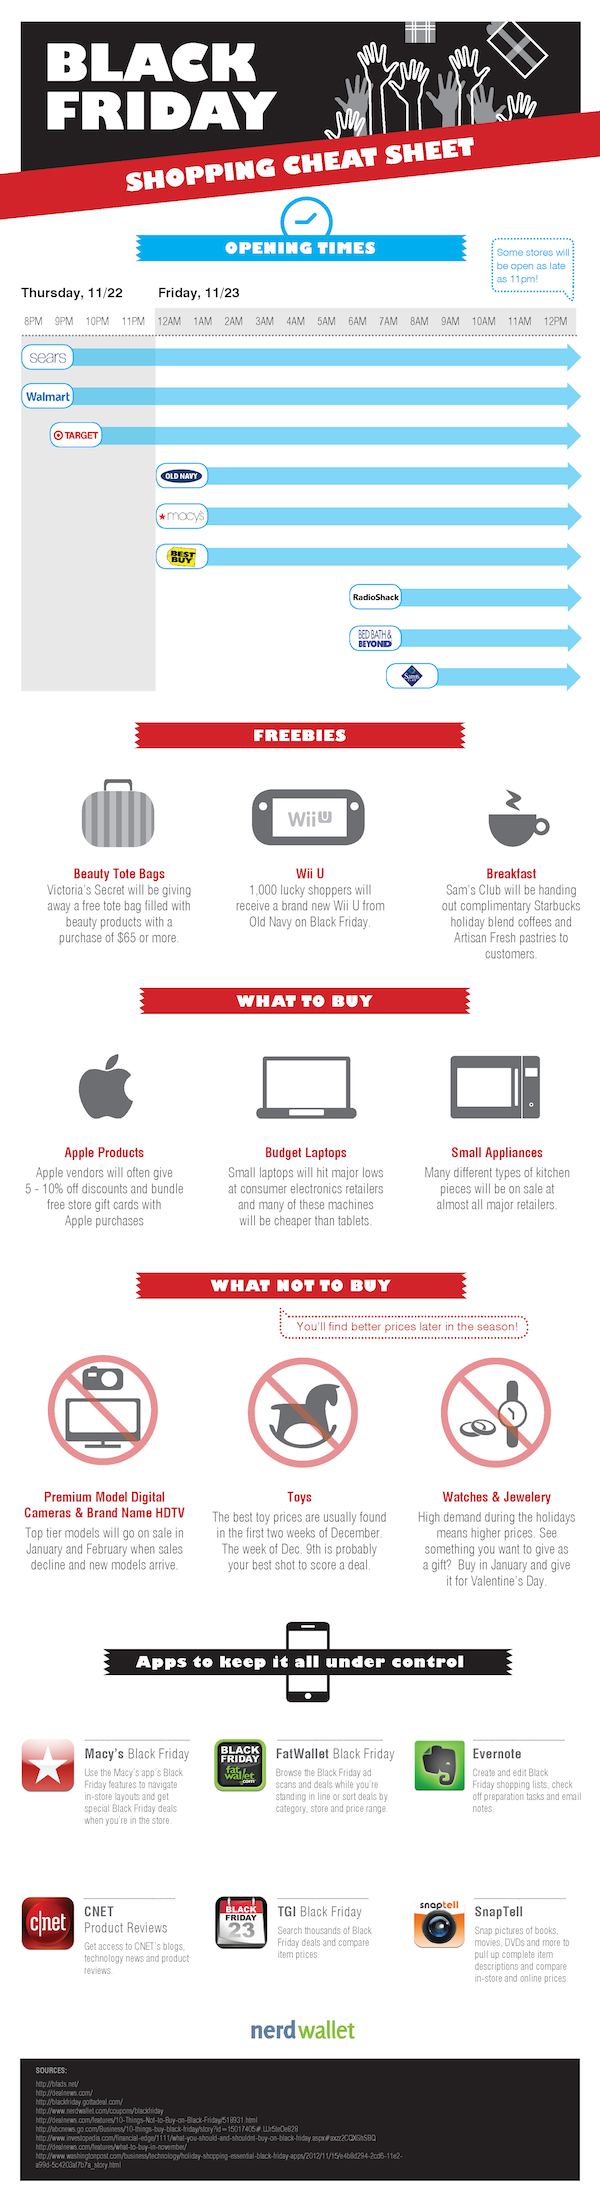
Black Friday Shopping Cheat Sheet
If you haven’t prepared as much as you might have wanted for Black Friday, relax. NerdWallet has an infographic to catch you up to speed on the most basic and most important parts of Black Friday. Get caught up to the camping out Black Friday shopaholics with information on what to buy, what not to buy, store opening times and apps to make things run smoothly.
Thanksgiving Dinner on a Budget
It’s hard to get into the “thanksgiving” mood when Thanksgiving dinner costs soar each year. But there is hope! Yummly presents some great tips for stretching your dollar this season, and creative ways to turn your leftovers into exciting new meals.
How To Deep Fry Your Entire Thanksgiving Dinner
This convenient guide from Macys.com shows you how to deep fry mashed potatoes, cranberry sauce, stuffing, green beans, apple pie and chocolate truffles. We’d advise that you pick a couple favorites without actually eating a whole meal of fried foods, lest you find yourself spending the holiday with your cardiologist.
100 Years of Women’s Fashion
Fashion trends are constantly in flux. What’s here today…is gone in about five minutes. And sometimes, what everybody was wearing twenty years ago can return in the blink of an eye. (We’re looking at you, ‘80s.) But fashion isn’t nearly as random as you may think. There’s a strong thread of history running through everything you wear.
History of Christmas Traditions
Across the world, Christmas is celebrated in a multitude of rich and cherished traditions. Their origins are wonderfully varied, emerging out of cultures and beliefs throughout history. This illustrated timeline, brought to you by Balsam Hill, captures the flow of some of the most popular Christmas traditions and figures and traces their simple lineage from St. Nicholas’ humble beginnings to today.
Infographics: 10 Things You Need To Know
The following infographic from Kevin Akers design + imagery is list of top ten things everyone should know about the new marketing phenomenon clarifies how to create interesting, noteworthy infographics.
If Children Ran Christmas…
Part of the magic of Christmas is seeing the day through a child’s eyes. So, Santa asked 500 children in the UK aged six to 10 what they would do if they were in charge of Christmas, and what they love about it. Whether they wanted to visit him in his home in Santa’s Lapland, give presents to all children that are poor and hungry or just eat more cheese, the results are sweet, funny and heart-warming.
It’s Time To Go Mobile
According to MobiThinking®, at the end of 2011, there were 6 billion mobile subscribers worldwide. That’s 87% of the world’s population! It’s been estimated that by the end of 2016, there will be 8 billion mobile subscribers. That means there is a mobile phone or device for nearly every person on the planet, accessing the Internet.
Holiday Shopping Online Trends
The following is a visual depiction of anticipated holiday shopping via the internet for the 2012 holiday season. The infographic Velaro by shows shopping trends based on age, gender, geography, and annual income.
Maximizing Your Dollars on Cyber Monday
Are you a Black Friday fanatic or bargain hunter that hates the crowd? More and more, consumers are turning to the Internet, mobile apps and e-coupons to stretch holiday dollars. Cyber Monday is the secret for holiday savings — are you in the know? Find out with the following infographic.
Black Friday Shopping Cheat Sheet
If you haven’t prepared as much as you might have wanted for Black Friday, relax. NerdWallet has an infographic to catch you up to speed on the most basic and most important parts of Black Friday. Get caught up to the camping out Black Friday shopaholics with information on what to buy, what not to buy, store opening times and apps to make things run smoothly.
Thanksgiving Dinner on a Budget
It’s hard to get into the “thanksgiving” mood when Thanksgiving dinner costs soar each year. But there is hope! Yummly presents some great tips for stretching your dollar this season, and creative ways to turn your leftovers into exciting new meals.
How To Deep Fry Your Entire Thanksgiving Dinner
This convenient guide from Macys.com shows you how to deep fry mashed potatoes, cranberry sauce, stuffing, green beans, apple pie and chocolate truffles. We’d advise that you pick a couple favorites without actually eating a whole meal of fried foods, lest you find yourself spending the holiday with your cardiologist.
Partners


Browse Archives By Category
Animated Infographics
Business Infographics
Career & Jobs Infographics
Education Infographics
Entertainment Industry Infographics
Environmental Infographics
Finance & Money Infographics
Food & Drink Infographics
Health Infographics
Historical Infographics
Home & Garden Infographics
Internet Infographics
Law and Legal Infographics
Lifestyle Infographics
Marketing Infographics
Offbeat Infographics
Parenting Infographics
Pets & Animals Infographics
Political Infographics
Shopping Infographics
Sports and Athletic Infographics
Technology Infographics
Transportation Infographics
Travel Infographics
Video Infographics