


Search 12,100+ Infographics!

Ultimate Moving House Checklist
Achieving a successful house move can be quiet challenging. There are various things you need to take care of prior and after moving. Therefore, you must prepare yourself mentally, emotionally and financially. This infographic by Pro Removalists Brisbane provides an extensive moving guide with a list of important items that must be included in your checklist.
Top 20 Home Made Cleaning Products
In our house cleaning, we may utilize different types of cleaning products to maintain its immaculate state. However, using these chemicals can have a severe repercussion to us and the environment. In this infographic, Pro Carpet Cleaning Sydney share the top 20 homemade cleaning products, including easy to follow recipes and natural ingredients you can use.
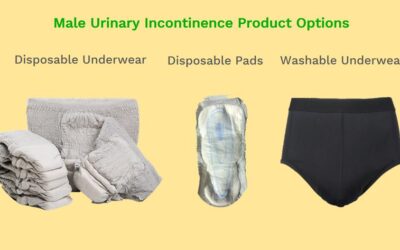
Male Urinary Incontinence Products – What Are Your Options?
One in four American men will face the reality of urinary incontinence at some point in their life. If you’re one of these men, then there’s no need to fear. It may, at first, be a difficult diagnosis to get your head around but you aren’t alone and there’s plenty of amazing treatment and product options to help you manage your symptoms on a daily basis.
A Beginner’s Guide to Topical Vitamin C
While it’s recommended to get your Vitamin C from foods, a lot of people are turning to supplements to get their dose of the healthy vitamin. Before you shop for a Vitamin C serum to add to your regimen, make sure that you completely understand its benefits, uses, and role in your skincare goals. Here is an infographic that breaks down and uncovers the characteristics and benefits of this extraordinary ingredient.

The Best 10 Carpet Stain Removal Tips
It’s inevitable that carpeting in your home can become stained any time. Therefore, savvy homeowners should be equipped with proven and tested techniques to remove carpet stains. In this infographic, the team at NO1 Carpet Cleaning Melbourne present the best 10 carpet stain removal tips, including the products and formula on how to make a homemade solutions.

Havoc in Your Datacenter?
Heat is the number 1 cause of equipment failure in your datacenter. Studies have also shown that cooling cost is the second most expensive ongoing cost in a datacenter. Equipment failure due to excessive heat is expensive and preventable, also the associated interruptions of service cost companies millions of dollars annually in lost revenue. Learn more about this in the following infographic.
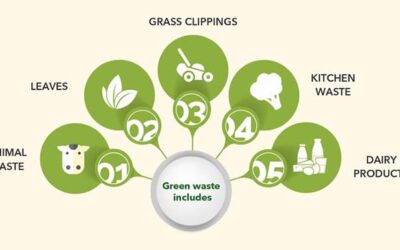
Guide To Household Green Waste
Climate change is one of the many negative impacts of poor waste disposal. For this reason, the governments worldwide have been making consistent efforts to achieve a sustainable waste management. Zero waste future could become a reality if we can promulgate effective recycling methods and provide access to a better education about proper rubbish disposal.

Top Chopping Techniques For Aspiring Chefs
Learning to chop can be a daunting task for aspiring chefs, with lots of techniques, knives and foods to consider. How do you know which technique to use for different types of foods? The folks at Nisbets have chosen the top four most valuable chopping techniques to learn when starting your journey to becoming a chef.

Top 10 Most Deadly Spiders in Australia
Aside from dealing with pest invasion all year round, Australia has been known to be home to some of the deadliest spiders on the planet. These range from snakes to scorpions to spiders. Here is an infographic from Eco Pest Control Brisbane that features the top 10 most deadly Australian Spiders.

What is Eminent Domain?
If you are a landowner, it’s important to know the facts about eminent domain. The government is allowed to take your land as long as they provide just compensation and claimed the land for public use. Learn more, courtesy of Dallas & Turner.
Ultimate Moving House Checklist
Achieving a successful house move can be quiet challenging. There are various things you need to take care of prior and after moving. Therefore, you must prepare yourself mentally, emotionally and financially. This infographic by Pro Removalists Brisbane provides an extensive moving guide with a list of important items that must be included in your checklist.
Top 20 Home Made Cleaning Products
In our house cleaning, we may utilize different types of cleaning products to maintain its immaculate state. However, using these chemicals can have a severe repercussion to us and the environment. In this infographic, Pro Carpet Cleaning Sydney share the top 20 homemade cleaning products, including easy to follow recipes and natural ingredients you can use.
Male Urinary Incontinence Products – What Are Your Options?
One in four American men will face the reality of urinary incontinence at some point in their life. If you’re one of these men, then there’s no need to fear. It may, at first, be a difficult diagnosis to get your head around but you aren’t alone and there’s plenty of amazing treatment and product options to help you manage your symptoms on a daily basis.
A Beginner’s Guide to Topical Vitamin C
While it’s recommended to get your Vitamin C from foods, a lot of people are turning to supplements to get their dose of the healthy vitamin. Before you shop for a Vitamin C serum to add to your regimen, make sure that you completely understand its benefits, uses, and role in your skincare goals. Here is an infographic that breaks down and uncovers the characteristics and benefits of this extraordinary ingredient.
The Best 10 Carpet Stain Removal Tips
It’s inevitable that carpeting in your home can become stained any time. Therefore, savvy homeowners should be equipped with proven and tested techniques to remove carpet stains. In this infographic, the team at NO1 Carpet Cleaning Melbourne present the best 10 carpet stain removal tips, including the products and formula on how to make a homemade solutions.
Havoc in Your Datacenter?
Heat is the number 1 cause of equipment failure in your datacenter. Studies have also shown that cooling cost is the second most expensive ongoing cost in a datacenter. Equipment failure due to excessive heat is expensive and preventable, also the associated interruptions of service cost companies millions of dollars annually in lost revenue. Learn more about this in the following infographic.
Guide To Household Green Waste
Climate change is one of the many negative impacts of poor waste disposal. For this reason, the governments worldwide have been making consistent efforts to achieve a sustainable waste management. Zero waste future could become a reality if we can promulgate effective recycling methods and provide access to a better education about proper rubbish disposal.
Top Chopping Techniques For Aspiring Chefs
Learning to chop can be a daunting task for aspiring chefs, with lots of techniques, knives and foods to consider. How do you know which technique to use for different types of foods? The folks at Nisbets have chosen the top four most valuable chopping techniques to learn when starting your journey to becoming a chef.
Top 10 Most Deadly Spiders in Australia
Aside from dealing with pest invasion all year round, Australia has been known to be home to some of the deadliest spiders on the planet. These range from snakes to scorpions to spiders. Here is an infographic from Eco Pest Control Brisbane that features the top 10 most deadly Australian Spiders.
What is Eminent Domain?
If you are a landowner, it’s important to know the facts about eminent domain. The government is allowed to take your land as long as they provide just compensation and claimed the land for public use. Learn more, courtesy of Dallas & Turner.
Partners


Browse Archives By Category
Animated Infographics
Business Infographics
Career & Jobs Infographics
Education Infographics
Entertainment Industry Infographics
Environmental Infographics
Finance & Money Infographics
Food & Drink Infographics
Health Infographics
Historical Infographics
Home & Garden Infographics
Internet Infographics
Law and Legal Infographics
Lifestyle Infographics
Marketing Infographics
Offbeat Infographics
Parenting Infographics
Pets & Animals Infographics
Political Infographics
Shopping Infographics
Sports and Athletic Infographics
Technology Infographics
Transportation Infographics
Travel Infographics
Video Infographics