


Search 12,100+ Infographics!
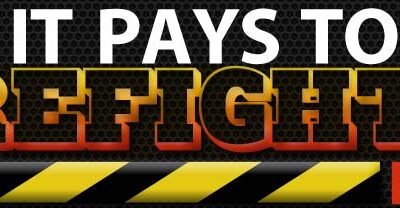
Why It Pays To Be a Firefighter
If you’re wondering whether it makes sense to invest the time and effort involved in a fire career, there’s good news: projections show strong expected growth throughout the rest of the decade, with a 19% increase – or over 57,000 new jobs – expected by 2020. While there are many very good reasons to consider a career as a fire fighter, potential earnings may be among the most attractive.
13 Most Common Places Where Kids Hide Drugs
Each year, more and more children fall into the many traps of drug abuse. Even children as young as ten years old have started experiencing with illegal drugs, most of which they pick up from their peers in school. Some even smoke marijuana at home and keep their stash in places undetected by parents. This infographic from TestCountry.com looks at 13 of the most common places that kids might be stashing their stash.
A Brief History of Watch Complications
Modern-day wristwatches are remarkably complex instruments; many of the higher-end models can tell not just the time, but the date, year, and Earth’s position around the sun as well. Take a visual journey through history with this infographic, published by Luxury Bazaar, to discover how mankind has kept time over the centuries, from the primitive sundial to the 21st century Rolex.
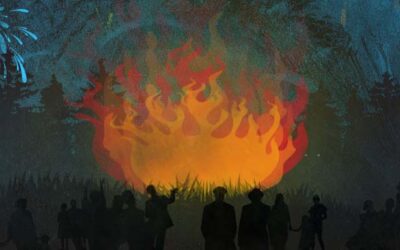
Bonfire Night – Your Visual Guide to a Safer 5th November
Every year 100’s if not 1000’s of accidents happen on bonfire night with children and animals. With a little education there is no reason why anyone need get hurt. The following infographic is a guide to help make sure these accidents are minimal.
The Logistics of Voting
The 2012 Presidential election is right around the corner and everyone is getting geared up to vote, making sure they are registered and know where they are supposed to go on voting day. However, have you ever wondered what goes on behind the scenes during the voting process? Well, wonder no more.
From Smoke Signals to the Cloud: A History of Business Telecommunications
Lately there have been many questions about the industries that still rely on fax and the new developments within the fax industry. Surprisingly, the fax industry is expected to grow over by over $1.035 billion within the next four years, yet most fax users are still using the antiquated faxing technologies. In efforts to commemorate how far this industry has come to the latest and greatest innovations for fax, Fax Compare has created an infographic highlighting these big events.

How Men and Women Spend Differently
Men and women spend and save money differently, but do you know how? The following infographic shows us how some American spending and saving habits can be gender specific.
Digital Signage: Big Screen on Campus
There are many benefits of using digital signage, some of which are staying up on the latest technology, relaying information to students and faculty in an interesting medium, and also a way to make revenue off of advertising. Check out the infographic below from DigitalSignageToday.com which goes into greater detail about how digital signage is making its way onto college campuses.
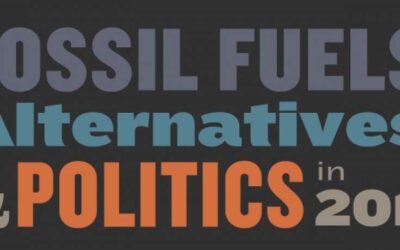
Fossil Fuels, Alternatives, and Politics in 2012
Reliance on fossil fuels has been a concern to government and the public for decades. Many want to abolish their use because of pollution, global warming and sustainability projections. Some deny the need for clean energy and reject projections as misinformation. What side is right?
U.S. vs China: Superpower Showdown
These giants boast the world’s largest economies and active militaries and their decisions influence politics at a global level. Despite a massive trade agreement and many diplomatic meetings, the two nations struggle to maintain the semblance of a civil relationship. As pressure mounts from U.S. leaders, China remains unfazed, coolly growing its military and economy.
Why It Pays To Be a Firefighter
If you’re wondering whether it makes sense to invest the time and effort involved in a fire career, there’s good news: projections show strong expected growth throughout the rest of the decade, with a 19% increase – or over 57,000 new jobs – expected by 2020. While there are many very good reasons to consider a career as a fire fighter, potential earnings may be among the most attractive.
13 Most Common Places Where Kids Hide Drugs
Each year, more and more children fall into the many traps of drug abuse. Even children as young as ten years old have started experiencing with illegal drugs, most of which they pick up from their peers in school. Some even smoke marijuana at home and keep their stash in places undetected by parents. This infographic from TestCountry.com looks at 13 of the most common places that kids might be stashing their stash.
A Brief History of Watch Complications
Modern-day wristwatches are remarkably complex instruments; many of the higher-end models can tell not just the time, but the date, year, and Earth’s position around the sun as well. Take a visual journey through history with this infographic, published by Luxury Bazaar, to discover how mankind has kept time over the centuries, from the primitive sundial to the 21st century Rolex.
Bonfire Night – Your Visual Guide to a Safer 5th November
Every year 100’s if not 1000’s of accidents happen on bonfire night with children and animals. With a little education there is no reason why anyone need get hurt. The following infographic is a guide to help make sure these accidents are minimal.
The Logistics of Voting
The 2012 Presidential election is right around the corner and everyone is getting geared up to vote, making sure they are registered and know where they are supposed to go on voting day. However, have you ever wondered what goes on behind the scenes during the voting process? Well, wonder no more.
From Smoke Signals to the Cloud: A History of Business Telecommunications
Lately there have been many questions about the industries that still rely on fax and the new developments within the fax industry. Surprisingly, the fax industry is expected to grow over by over $1.035 billion within the next four years, yet most fax users are still using the antiquated faxing technologies. In efforts to commemorate how far this industry has come to the latest and greatest innovations for fax, Fax Compare has created an infographic highlighting these big events.
How Men and Women Spend Differently
Men and women spend and save money differently, but do you know how? The following infographic shows us how some American spending and saving habits can be gender specific.
Digital Signage: Big Screen on Campus
There are many benefits of using digital signage, some of which are staying up on the latest technology, relaying information to students and faculty in an interesting medium, and also a way to make revenue off of advertising. Check out the infographic below from DigitalSignageToday.com which goes into greater detail about how digital signage is making its way onto college campuses.
Fossil Fuels, Alternatives, and Politics in 2012
Reliance on fossil fuels has been a concern to government and the public for decades. Many want to abolish their use because of pollution, global warming and sustainability projections. Some deny the need for clean energy and reject projections as misinformation. What side is right?
U.S. vs China: Superpower Showdown
These giants boast the world’s largest economies and active militaries and their decisions influence politics at a global level. Despite a massive trade agreement and many diplomatic meetings, the two nations struggle to maintain the semblance of a civil relationship. As pressure mounts from U.S. leaders, China remains unfazed, coolly growing its military and economy.
Partners


Browse Archives By Category
Animated Infographics
Business Infographics
Career & Jobs Infographics
Education Infographics
Entertainment Industry Infographics
Environmental Infographics
Finance & Money Infographics
Food & Drink Infographics
Health Infographics
Historical Infographics
Home & Garden Infographics
Internet Infographics
Law and Legal Infographics
Lifestyle Infographics
Marketing Infographics
Offbeat Infographics
Parenting Infographics
Pets & Animals Infographics
Political Infographics
Shopping Infographics
Sports and Athletic Infographics
Technology Infographics
Transportation Infographics
Travel Infographics
Video Infographics