


Search 12,100+ Infographics!

Is An Online Education Right for You?
Online education has experienced a boom in the last several years. More and more students, young and old are enrolling in some type of online classes, and even Bill Gates thinks the future of education is distance learning.. The following infographic from Independence University looks at whether online education is right for you.

Driving License To Kill – The Best Bond Vehicle Gadgets
James Bond has been stopping the bad guys and getting the girl on the big screen for 50 years now. But we’re not sure he would have lasted as long as he has without the aid of his state-of-the-art vehicle gadgets. Bond’s expert use of these gadgets has been thrilling and entertaining audiences for half a century.
HTML 5 & Beyond
This infographic summarizes the need-to-know facts about HTML5 and brings them to life with animation produced using HTML5 (animated version). With already plenty of infographics out there on the subject of HTML5, why not do something that would stand out. The big idea? If it’s all about HTML5, why not animate the infographic using HTML5?
Does Your Cat Keep You Up at Night?
Are you in the category of cat owners that feel like your pet won’t let you sleep at night? Although most cats sleep up to 18 hours a day, daytime “cat” naps do make up most of that equation. Check out the following infographic to see if you can relate. Answer according to your cat’s behavior, and try the solutions provided.
The Ultimate Zombie Apocalypse Guide
Unlike natural disasters, the zombie apocalypse is quite unnatural and features one pretty unique component: flesh-eating zombies. If you want to keep your head—and everything else—when the zombie apocalypse comes, you’ll need to prepare. Whether you plan to hunt down the living dead or lay low when it all goes down, now is the time to plan, research, and train.
Who Hates Payday Loans the Most
The following infographic is a visual representation of the 2012 I Hate You Payday Loans Industry Sentiment Survey. Payday loan hatred seems to overrun the industry as payday loans are not the ideal financial solution – the high interest rates, predatory accusations, fast cash but high risk – you don’t have to love the products, but you do have to understand them if you’re going to borrow them.
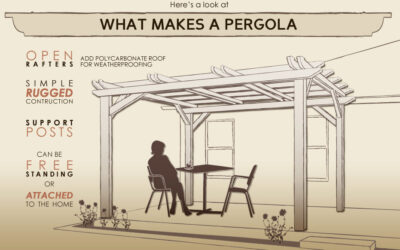
Pergolas: Outdoor Living in Style
A pergola is one of the most attractive and elegant ways to add interest to your landscape. Whether you’re looking to bring shade to your outdoor living space or create a walkway overhung with climbing vines, the pergola provides a simple, cost-effective solution that will add value to your home.

Midlife Crisis & Worst College Degrees
Did you know that the average American changes careers seven times in their lifetime? One of the biggest problems with adults and their careers is many of them are not satisfied. This infographic highlights some of the reasons people are dissatisfied with their jobs as well as some possible solutions.
The Reddit Marketing Field Guide
Billing itself as “the front page of the internet”, Reddit is one of the most popular sites on the Internet. With millions of subscribers and billions of page views, Reddit has the power to make or break any online campaign. Take a closer look at this social powerhouse and see how you can reach out to the millions of Redditers out there.

Your Boss Is Insane
Have you ever had a boss you thought deserved a padded cell? You’re not alone. Nearly one third of employees think their bosses should see a psychologist. And as it turns out, your so-called jaded assumptions might not be that far off.The following infographic from the folks at LearnStuff highlights many of the signs that you boss may be insane as well as the effect it can have on you.
Is An Online Education Right for You?
Online education has experienced a boom in the last several years. More and more students, young and old are enrolling in some type of online classes, and even Bill Gates thinks the future of education is distance learning.. The following infographic from Independence University looks at whether online education is right for you.
Driving License To Kill – The Best Bond Vehicle Gadgets
James Bond has been stopping the bad guys and getting the girl on the big screen for 50 years now. But we’re not sure he would have lasted as long as he has without the aid of his state-of-the-art vehicle gadgets. Bond’s expert use of these gadgets has been thrilling and entertaining audiences for half a century.
HTML 5 & Beyond
This infographic summarizes the need-to-know facts about HTML5 and brings them to life with animation produced using HTML5 (animated version). With already plenty of infographics out there on the subject of HTML5, why not do something that would stand out. The big idea? If it’s all about HTML5, why not animate the infographic using HTML5?
Does Your Cat Keep You Up at Night?
Are you in the category of cat owners that feel like your pet won’t let you sleep at night? Although most cats sleep up to 18 hours a day, daytime “cat” naps do make up most of that equation. Check out the following infographic to see if you can relate. Answer according to your cat’s behavior, and try the solutions provided.
The Ultimate Zombie Apocalypse Guide
Unlike natural disasters, the zombie apocalypse is quite unnatural and features one pretty unique component: flesh-eating zombies. If you want to keep your head—and everything else—when the zombie apocalypse comes, you’ll need to prepare. Whether you plan to hunt down the living dead or lay low when it all goes down, now is the time to plan, research, and train.
Who Hates Payday Loans the Most
The following infographic is a visual representation of the 2012 I Hate You Payday Loans Industry Sentiment Survey. Payday loan hatred seems to overrun the industry as payday loans are not the ideal financial solution – the high interest rates, predatory accusations, fast cash but high risk – you don’t have to love the products, but you do have to understand them if you’re going to borrow them.
Pergolas: Outdoor Living in Style
A pergola is one of the most attractive and elegant ways to add interest to your landscape. Whether you’re looking to bring shade to your outdoor living space or create a walkway overhung with climbing vines, the pergola provides a simple, cost-effective solution that will add value to your home.
Midlife Crisis & Worst College Degrees
Did you know that the average American changes careers seven times in their lifetime? One of the biggest problems with adults and their careers is many of them are not satisfied. This infographic highlights some of the reasons people are dissatisfied with their jobs as well as some possible solutions.
The Reddit Marketing Field Guide
Billing itself as “the front page of the internet”, Reddit is one of the most popular sites on the Internet. With millions of subscribers and billions of page views, Reddit has the power to make or break any online campaign. Take a closer look at this social powerhouse and see how you can reach out to the millions of Redditers out there.
Your Boss Is Insane
Have you ever had a boss you thought deserved a padded cell? You’re not alone. Nearly one third of employees think their bosses should see a psychologist. And as it turns out, your so-called jaded assumptions might not be that far off.The following infographic from the folks at LearnStuff highlights many of the signs that you boss may be insane as well as the effect it can have on you.
Partners


Browse Archives By Category
Animated Infographics
Business Infographics
Career & Jobs Infographics
Education Infographics
Entertainment Industry Infographics
Environmental Infographics
Finance & Money Infographics
Food & Drink Infographics
Health Infographics
Historical Infographics
Home & Garden Infographics
Internet Infographics
Law and Legal Infographics
Lifestyle Infographics
Marketing Infographics
Offbeat Infographics
Parenting Infographics
Pets & Animals Infographics
Political Infographics
Shopping Infographics
Sports and Athletic Infographics
Technology Infographics
Transportation Infographics
Travel Infographics
Video Infographics