


Search 12,100+ Infographics!
The Ultimate Zombie Apocalypse Guide
Unlike natural disasters, the zombie apocalypse is quite unnatural and features one pretty unique component: flesh-eating zombies. If you want to keep your head—and everything else—when the zombie apocalypse comes, you’ll need to prepare. Whether you plan to hunt down the living dead or lay low when it all goes down, now is the time to plan, research, and train.
Who Hates Payday Loans the Most
The following infographic is a visual representation of the 2012 I Hate You Payday Loans Industry Sentiment Survey. Payday loan hatred seems to overrun the industry as payday loans are not the ideal financial solution – the high interest rates, predatory accusations, fast cash but high risk – you don’t have to love the products, but you do have to understand them if you’re going to borrow them.
Pergolas: Outdoor Living in Style
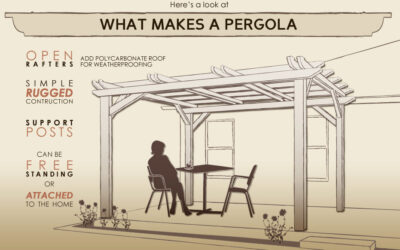
A pergola is one of the most attractive and elegant ways to add interest to your landscape. Whether you’re looking to bring shade to your outdoor living space or create a walkway overhung with climbing vines, the pergola provides a simple, cost-effective solution that will add value to your home.

Midlife Crisis & Worst College Degrees
Did you know that the average American changes careers seven times in their lifetime? One of the biggest problems with adults and their careers is many of them are not satisfied. This infographic highlights some of the reasons people are dissatisfied with their jobs as well as some possible solutions.
The Reddit Marketing Field Guide
Billing itself as “the front page of the internet”, Reddit is one of the most popular sites on the Internet. With millions of subscribers and billions of page views, Reddit has the power to make or break any online campaign. Take a closer look at this social powerhouse and see how you can reach out to the millions of Redditers out there.
Your Boss Is Insane
Have you ever had a boss you thought deserved a padded cell? You’re not alone. Nearly one third of employees think their bosses should see a psychologist. And as it turns out, your so-called jaded assumptions might not be that far off.The following infographic from the folks at LearnStuff highlights many of the signs that you boss may be insane as well as the effect it can have on you.
The Ultimate Guide to Safer Sex
A “roll in the hay” can be a good time. There’s no doubting that! However, there’s much more to sexual health than just getting it on. This infographic from Greatist shows you what you need to know.
Obama vs Romney on Cybersecurity
Whether you think so or not, cybersecurity is an important issue in the United States. Especially because most of our infrastructure is run wirelessly. So with the presidential election right around the corner, it’s important to know where both candidates stand on this issue. Check out the infographic below presented by Veracode to learn more.
How Big Our Cars Have Gotten
It’s no doubt that American’s love everything bigger. From McDonald’s supersize it option, to big diesel trucks; everything seems to be bigger in America. And what do you know, you can even our cars have gotten larger over the years. The following infographic from Automotive.com shows how much larger our cars have gotten over the years.
Is Google+ a Ghost Town?
There’s been many opinions about how good, bad and indifferent Google+ is. One debate that is ongoing is “It’s Really Popular Vs It’s A Ghost Town.” So what’s the truth? Findings from Umpf appear to suggest the latter. Despite its large number of accounts, G+ is bottom of the list of social network users’ favored channels.
The Ultimate Zombie Apocalypse Guide
Unlike natural disasters, the zombie apocalypse is quite unnatural and features one pretty unique component: flesh-eating zombies. If you want to keep your head—and everything else—when the zombie apocalypse comes, you’ll need to prepare. Whether you plan to hunt down the living dead or lay low when it all goes down, now is the time to plan, research, and train.
Who Hates Payday Loans the Most
The following infographic is a visual representation of the 2012 I Hate You Payday Loans Industry Sentiment Survey. Payday loan hatred seems to overrun the industry as payday loans are not the ideal financial solution – the high interest rates, predatory accusations, fast cash but high risk – you don’t have to love the products, but you do have to understand them if you’re going to borrow them.
Pergolas: Outdoor Living in Style
A pergola is one of the most attractive and elegant ways to add interest to your landscape. Whether you’re looking to bring shade to your outdoor living space or create a walkway overhung with climbing vines, the pergola provides a simple, cost-effective solution that will add value to your home.
Midlife Crisis & Worst College Degrees
Did you know that the average American changes careers seven times in their lifetime? One of the biggest problems with adults and their careers is many of them are not satisfied. This infographic highlights some of the reasons people are dissatisfied with their jobs as well as some possible solutions.
The Reddit Marketing Field Guide
Billing itself as “the front page of the internet”, Reddit is one of the most popular sites on the Internet. With millions of subscribers and billions of page views, Reddit has the power to make or break any online campaign. Take a closer look at this social powerhouse and see how you can reach out to the millions of Redditers out there.
Your Boss Is Insane
Have you ever had a boss you thought deserved a padded cell? You’re not alone. Nearly one third of employees think their bosses should see a psychologist. And as it turns out, your so-called jaded assumptions might not be that far off.The following infographic from the folks at LearnStuff highlights many of the signs that you boss may be insane as well as the effect it can have on you.
The Ultimate Guide to Safer Sex
A “roll in the hay” can be a good time. There’s no doubting that! However, there’s much more to sexual health than just getting it on. This infographic from Greatist shows you what you need to know.
Obama vs Romney on Cybersecurity
Whether you think so or not, cybersecurity is an important issue in the United States. Especially because most of our infrastructure is run wirelessly. So with the presidential election right around the corner, it’s important to know where both candidates stand on this issue. Check out the infographic below presented by Veracode to learn more.
How Big Our Cars Have Gotten
It’s no doubt that American’s love everything bigger. From McDonald’s supersize it option, to big diesel trucks; everything seems to be bigger in America. And what do you know, you can even our cars have gotten larger over the years. The following infographic from Automotive.com shows how much larger our cars have gotten over the years.
Is Google+ a Ghost Town?
There’s been many opinions about how good, bad and indifferent Google+ is. One debate that is ongoing is “It’s Really Popular Vs It’s A Ghost Town.” So what’s the truth? Findings from Umpf appear to suggest the latter. Despite its large number of accounts, G+ is bottom of the list of social network users’ favored channels.
Partners


Browse Archives By Category
Animated Infographics
Business Infographics
Career & Jobs Infographics
Education Infographics
Entertainment Industry Infographics
Environmental Infographics
Finance & Money Infographics
Food & Drink Infographics
Health Infographics
Historical Infographics
Home & Garden Infographics
Internet Infographics
Law and Legal Infographics
Lifestyle Infographics
Marketing Infographics
Offbeat Infographics
Parenting Infographics
Pets & Animals Infographics
Political Infographics
Shopping Infographics
Sports and Athletic Infographics
Technology Infographics
Transportation Infographics
Travel Infographics
Video Infographics