


Search 12,100+ Infographics!

What Is the Most Common Birthday Month and Year in the U.S.?
In a new study, Kremp Florist reveals Americans’ most common birth date and year. They found that August has the highest concentration of birthdays in 45 states, prompting questions about why this might be.

7 Ways Aging Affects Driving
According to the National Safety Council (NSC), 4,829 drivers aged 65 and older were killed in traffic crashes in 2023. But while overall crash rates for senior drivers are actually lower than for other groups, older drivers have higher rates of crashes per mile driven. This suggests that they drive less, but are still at higher risk than other groups.

What is the Most Popular Social Media Platform for Each Age Group?
Studying the social media landscape shows that generations have different platform usage patterns. Younger people enjoy embracing and exploring new platforms while more and more older people migrate to the world of social media. This analysis reveals that platform popularity can shift among different age demographics as new platforms emerge.
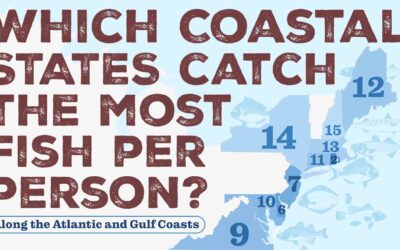
Which Coastal States Catch the Most Fish Per Person?
America’s seaboard is full of diverse marine ecosystems, with each state’s composition of fish caught telling an ecological story. We can explore that story in SI Yacht’s new graphic which shows how many fish per person are caught in coastal states and the distribution among fish species.

Selling Your Law Firm – A Comprehensive Guide
Check out this comprehensive guide to learn about how to sell your law firm for maximum value with sections on preparing your law firm for sale, things that potential buyers will check closely, efficient operations that will boost your firm’s value, potential buyers that you should consider, the benefits of hiring a broker or advisor to help you sell and lots more.

30 Statistics About Data Breaches
Data breaches are a major cybersecurity threat, costing companies millions per breach. Ooma’s detailed collection of statistical facts shows that timing is everything when preventing and responding to data breaches. This graphic shows that data is often left vulnerable for an alarming amount of time.

What Are the Best Places in the U.S. for Snowbirds?
Snowbirds are sun-lovers who flock south to seek out sunshine and warm weather to escape the dreary, snowy, often brutal northern winters. A recent study from Florida Rentals creates a scoring system to determine the best locations for America’s snowbirds.

What Percentage of the Workforce Has Been Self-Employed Over Time?
Technology has transformed the self-employed workforce in America, creating new roles and new fields of work alongside revolutionizing the way people work in traditional careers. The Ooma team examined the rates of self-employment over time, including gig work on platforms like DoorDash, Uber, and Instacart.

In Which States Do Children Drink the Most Soda?
The team at PARequirements studied the amount of children’s soda consumption in states across America to determine where kids drink the most and least soda. The findings are revealed in a map that displays a clear “soda belt” in southern states where consumption is highest.
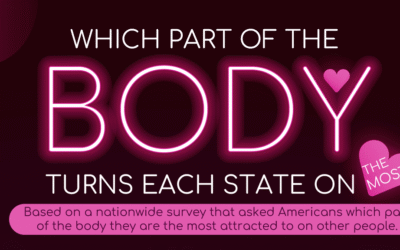
Which Part of the Body Turns Each State on the Most?
NapLab’s new study on attraction sheds light on how culture and location can create distinct preferences in physical attraction across the U.S. The research shows that our standards of beauty aren’t universal. Geography, climate, and local culture seem to influence what Americans are attracted to.
What Is the Most Common Birthday Month and Year in the U.S.?
In a new study, Kremp Florist reveals Americans’ most common birth date and year. They found that August has the highest concentration of birthdays in 45 states, prompting questions about why this might be.
7 Ways Aging Affects Driving
According to the National Safety Council (NSC), 4,829 drivers aged 65 and older were killed in traffic crashes in 2023. But while overall crash rates for senior drivers are actually lower than for other groups, older drivers have higher rates of crashes per mile driven. This suggests that they drive less, but are still at higher risk than other groups.
What is the Most Popular Social Media Platform for Each Age Group?
Studying the social media landscape shows that generations have different platform usage patterns. Younger people enjoy embracing and exploring new platforms while more and more older people migrate to the world of social media. This analysis reveals that platform popularity can shift among different age demographics as new platforms emerge.
Which Coastal States Catch the Most Fish Per Person?
America’s seaboard is full of diverse marine ecosystems, with each state’s composition of fish caught telling an ecological story. We can explore that story in SI Yacht’s new graphic which shows how many fish per person are caught in coastal states and the distribution among fish species.
Selling Your Law Firm – A Comprehensive Guide
Check out this comprehensive guide to learn about how to sell your law firm for maximum value with sections on preparing your law firm for sale, things that potential buyers will check closely, efficient operations that will boost your firm’s value, potential buyers that you should consider, the benefits of hiring a broker or advisor to help you sell and lots more.
30 Statistics About Data Breaches
Data breaches are a major cybersecurity threat, costing companies millions per breach. Ooma’s detailed collection of statistical facts shows that timing is everything when preventing and responding to data breaches. This graphic shows that data is often left vulnerable for an alarming amount of time.
What Are the Best Places in the U.S. for Snowbirds?
Snowbirds are sun-lovers who flock south to seek out sunshine and warm weather to escape the dreary, snowy, often brutal northern winters. A recent study from Florida Rentals creates a scoring system to determine the best locations for America’s snowbirds.
What Percentage of the Workforce Has Been Self-Employed Over Time?
Technology has transformed the self-employed workforce in America, creating new roles and new fields of work alongside revolutionizing the way people work in traditional careers. The Ooma team examined the rates of self-employment over time, including gig work on platforms like DoorDash, Uber, and Instacart.
In Which States Do Children Drink the Most Soda?
The team at PARequirements studied the amount of children’s soda consumption in states across America to determine where kids drink the most and least soda. The findings are revealed in a map that displays a clear “soda belt” in southern states where consumption is highest.
Which Part of the Body Turns Each State on the Most?
NapLab’s new study on attraction sheds light on how culture and location can create distinct preferences in physical attraction across the U.S. The research shows that our standards of beauty aren’t universal. Geography, climate, and local culture seem to influence what Americans are attracted to.
Partners


Browse Archives By Category
Animated Infographics
Business Infographics
Career & Jobs Infographics
Education Infographics
Entertainment Industry Infographics
Environmental Infographics
Finance & Money Infographics
Food & Drink Infographics
Health Infographics
Historical Infographics
Home & Garden Infographics
Internet Infographics
Law and Legal Infographics
Lifestyle Infographics
Marketing Infographics
Offbeat Infographics
Parenting Infographics
Pets & Animals Infographics
Political Infographics
Shopping Infographics
Sports and Athletic Infographics
Technology Infographics
Transportation Infographics
Travel Infographics
Video Infographics