


Search 12,100+ Infographics!
8 Email Design Factors that Influence Decision
What influences your subscribers’ willingness to open, click, and interact with your email? From subject lines and “from addresses” to images and landing pages, they all play a major role in determining whether your subscribers will engage with your email or not. You have about 3-4 seconds to grab your readers’ attention and interest them enough to open and read your email. In order to do this, you must design for your subscribers.

The Most Social Colleges
Have you ever wondered how social your college is, or if they are social at all? Social media is a great way for colleges to stay in touch with students and faculty, and to send them updates quickly. This infographic highlights some of the most social colleges.
America’s Favorite Tool – The Power Drill
Even if you don’t consider yourself much of a do-it-yourselfer, chances are at some point in your life you’ve used a power drill. Check out this infographic from eReplacementParts.com to learn some interesting facts about America’s favorite tool.
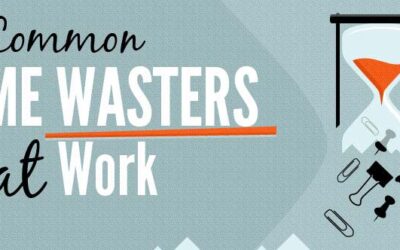
3 Common Time Wasters at Work
No business can afford to have wasted time at work, especially when growth and profitability is directly tied to employee productivity. Check out the following infographic from Time Doctor that identifies 3 of the most common reasons for wasted time.
Grow Your Business With Online Video
One Productions’ infographic illustrates a simple 3 step video marketing process to help you target your desired demographic by harnessing the power of online video production and the right social media channels for your brand strategy. The infographic provides some of the key reasons why video is so important to your business right now, and it lays out a simple 3-step process to start you on your path toward online video marketing success.
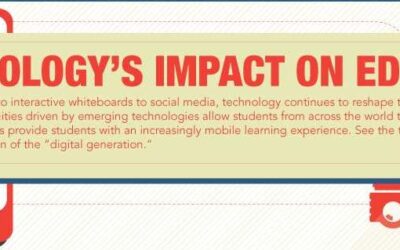
Technology’s Impact on Education
From online learning to interactive whiteboards to social media, technology continues to reshape the college experience. Online social communities allow students from across the word to collaborate on projects. Learn about the technologies and innovations fostering the education of the “digital generation” in the following infographic.
The Science of Beer Goggles
Have you ever wondered why after a few drinks people start to look more attractive, and you start to be more flirty? Well, wonder no more. This infographic presented by Free Dating.co.uk illustrates the science behind the dreaded beer goggles. Check it out below to learn more.
6 Reasons You Should Use a Boat Cover
Conscientious boat owners realize the importance of putting their watercraft to bed for winter. Failure to winterize your boat can result in a host of maintenance problems – and ultimately can shorten the life of your boat. One of the best ways to protect your boat during the winter is to invest in a boat cover. When properly fitted, a boat cover can increase the longevity of your craft by up to 30 percent. To help boat owners understand the benefits of using a boat cover, here is an infographic that provides 6 reasons you should use a boat cover.
When Allergies Attack: Asthma and Allergies in America
Recent U.S. statistics on asthma and allergy illustrate just how many Americans are sensitive to low quality air. While many people assume the air in their home is clean, the reality is that indoor air can be up anywhere from 2 to 100 times more polluted than outdoor air. Read the following infographic from Oransi to learn more about some common risk factors and triggers as well as the annual costs of asthma, allergies and poor indoor air quality in the United States.
App Building 101
What all is involved in the process for building a mobile app for iPhones and Androids? Here is an infographic put together to address the major phases of the app development process.
8 Email Design Factors that Influence Decision
What influences your subscribers’ willingness to open, click, and interact with your email? From subject lines and “from addresses” to images and landing pages, they all play a major role in determining whether your subscribers will engage with your email or not. You have about 3-4 seconds to grab your readers’ attention and interest them enough to open and read your email. In order to do this, you must design for your subscribers.
The Most Social Colleges
Have you ever wondered how social your college is, or if they are social at all? Social media is a great way for colleges to stay in touch with students and faculty, and to send them updates quickly. This infographic highlights some of the most social colleges.
America’s Favorite Tool – The Power Drill
Even if you don’t consider yourself much of a do-it-yourselfer, chances are at some point in your life you’ve used a power drill. Check out this infographic from eReplacementParts.com to learn some interesting facts about America’s favorite tool.
3 Common Time Wasters at Work
No business can afford to have wasted time at work, especially when growth and profitability is directly tied to employee productivity. Check out the following infographic from Time Doctor that identifies 3 of the most common reasons for wasted time.
Grow Your Business With Online Video
One Productions’ infographic illustrates a simple 3 step video marketing process to help you target your desired demographic by harnessing the power of online video production and the right social media channels for your brand strategy. The infographic provides some of the key reasons why video is so important to your business right now, and it lays out a simple 3-step process to start you on your path toward online video marketing success.
Technology’s Impact on Education
From online learning to interactive whiteboards to social media, technology continues to reshape the college experience. Online social communities allow students from across the word to collaborate on projects. Learn about the technologies and innovations fostering the education of the “digital generation” in the following infographic.
The Science of Beer Goggles
Have you ever wondered why after a few drinks people start to look more attractive, and you start to be more flirty? Well, wonder no more. This infographic presented by Free Dating.co.uk illustrates the science behind the dreaded beer goggles. Check it out below to learn more.
6 Reasons You Should Use a Boat Cover
Conscientious boat owners realize the importance of putting their watercraft to bed for winter. Failure to winterize your boat can result in a host of maintenance problems – and ultimately can shorten the life of your boat. One of the best ways to protect your boat during the winter is to invest in a boat cover. When properly fitted, a boat cover can increase the longevity of your craft by up to 30 percent. To help boat owners understand the benefits of using a boat cover, here is an infographic that provides 6 reasons you should use a boat cover.
When Allergies Attack: Asthma and Allergies in America
Recent U.S. statistics on asthma and allergy illustrate just how many Americans are sensitive to low quality air. While many people assume the air in their home is clean, the reality is that indoor air can be up anywhere from 2 to 100 times more polluted than outdoor air. Read the following infographic from Oransi to learn more about some common risk factors and triggers as well as the annual costs of asthma, allergies and poor indoor air quality in the United States.
App Building 101
What all is involved in the process for building a mobile app for iPhones and Androids? Here is an infographic put together to address the major phases of the app development process.
Partners


Browse Archives By Category
Animated Infographics
Business Infographics
Career & Jobs Infographics
Education Infographics
Entertainment Industry Infographics
Environmental Infographics
Finance & Money Infographics
Food & Drink Infographics
Health Infographics
Historical Infographics
Home & Garden Infographics
Internet Infographics
Law and Legal Infographics
Lifestyle Infographics
Marketing Infographics
Offbeat Infographics
Parenting Infographics
Pets & Animals Infographics
Political Infographics
Shopping Infographics
Sports and Athletic Infographics
Technology Infographics
Transportation Infographics
Travel Infographics
Video Infographics