


Search 12,100+ Infographics!
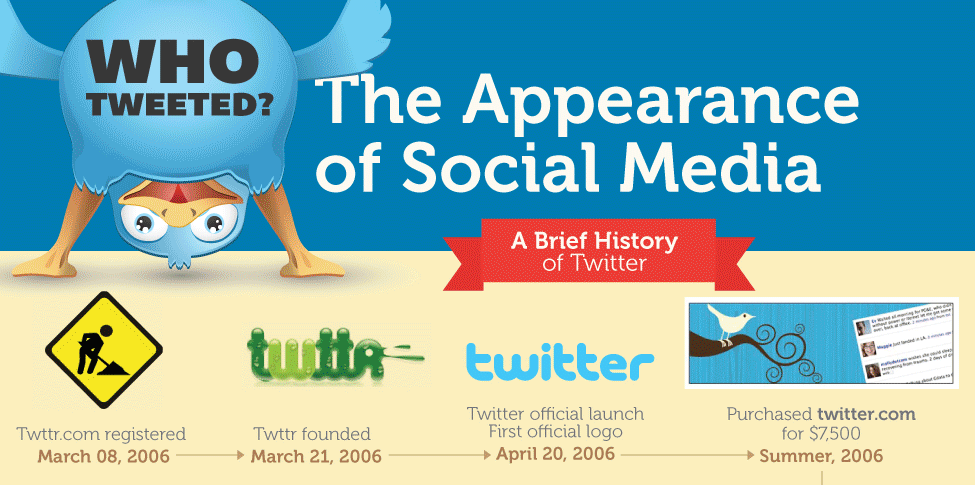
Twitter Followers – Who’s Faking It?
The appearance of social media is sometimes deceiving. The following infographic takes a look at the very first fake account on Twitter and continues on to show how companies, celebrities and even Presidential candidates are under the microscope when it comes to their Twitter followers
Dog-Proofing Your Computer
Our canine companions love to run and play near computers. This is not always good for for our PCs and can sometimes be unsafe for our favorite pets as well. The following infographic provides some helpful tips on how to prevent your computer from being damaged by your dog.
Differences Between Women and Men When Furniture Shopping
The following infographic provides a fun comparison between the behaviors of men and women while they are shopping for furniture. The results may surprise you.

The ROI of Higher Education
Is higher education a good investment? According to the following infographic. a high school dropout will earn $260,000 less than a high school graduate and $800,000 less than a college graduate in their lifetime.
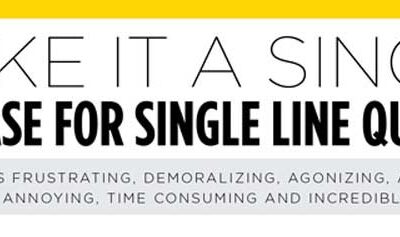
The Case for Single Line Queuing
This infographic from Lavi Industries addresses common concerns over the choice of single line or multiple waiting line configurations. The graphic presents key challenges and the business case for single line queuing.
Engines Compared: Electric, Hybrid, Gasoline and Diesel
Alternative fuel use is evolving, but how does it affect auto costs, safety and the environment? These are things you should know! Whether you’re in the market for a new ride, studying sustainability or economics, work in the auto industry or just want to educate yourself, it’s crucial to understand what the future of energy looks like.
What is Ovarian Cancer?
In the infographic below by Mount Sinai Medical Center, learn about the three main types of ovarian cancer, the risk factors, symptoms, treatment options and ways to minimize your risk of getting it.
Facebook New & Upcoming Features
Discover the new and upcoming features that Facebook will soon be showering upon us in the infographic below by Social Media Hive.
The Most Dependable Cars on the Road Today
This infographic by Cheap Car Insurance takes a peek into the 2012 most dependable and safest cars on the road based on the latest JD Power and Consumer Reports findings. Is your car listed, whether for good or for bad?
Sneakiest Product Placements in Entertainment
This infographic by Cool Cat Casino depicts how the best product placements in movies and TV shows have been done over the past few years. In some examples they even tell you about the outcome.
Twitter Followers – Who’s Faking It?
The appearance of social media is sometimes deceiving. The following infographic takes a look at the very first fake account on Twitter and continues on to show how companies, celebrities and even Presidential candidates are under the microscope when it comes to their Twitter followers
Dog-Proofing Your Computer
Our canine companions love to run and play near computers. This is not always good for for our PCs and can sometimes be unsafe for our favorite pets as well. The following infographic provides some helpful tips on how to prevent your computer from being damaged by your dog.
Differences Between Women and Men When Furniture Shopping
The following infographic provides a fun comparison between the behaviors of men and women while they are shopping for furniture. The results may surprise you.
The ROI of Higher Education
Is higher education a good investment? According to the following infographic. a high school dropout will earn $260,000 less than a high school graduate and $800,000 less than a college graduate in their lifetime.
The Case for Single Line Queuing
This infographic from Lavi Industries addresses common concerns over the choice of single line or multiple waiting line configurations. The graphic presents key challenges and the business case for single line queuing.
Engines Compared: Electric, Hybrid, Gasoline and Diesel
Alternative fuel use is evolving, but how does it affect auto costs, safety and the environment? These are things you should know! Whether you’re in the market for a new ride, studying sustainability or economics, work in the auto industry or just want to educate yourself, it’s crucial to understand what the future of energy looks like.
What is Ovarian Cancer?
In the infographic below by Mount Sinai Medical Center, learn about the three main types of ovarian cancer, the risk factors, symptoms, treatment options and ways to minimize your risk of getting it.
Facebook New & Upcoming Features
Discover the new and upcoming features that Facebook will soon be showering upon us in the infographic below by Social Media Hive.
The Most Dependable Cars on the Road Today
This infographic by Cheap Car Insurance takes a peek into the 2012 most dependable and safest cars on the road based on the latest JD Power and Consumer Reports findings. Is your car listed, whether for good or for bad?
Sneakiest Product Placements in Entertainment
This infographic by Cool Cat Casino depicts how the best product placements in movies and TV shows have been done over the past few years. In some examples they even tell you about the outcome.
Partners


Browse Archives By Category
Animated Infographics
Business Infographics
Career & Jobs Infographics
Education Infographics
Entertainment Industry Infographics
Environmental Infographics
Finance & Money Infographics
Food & Drink Infographics
Health Infographics
Historical Infographics
Home & Garden Infographics
Internet Infographics
Law and Legal Infographics
Lifestyle Infographics
Marketing Infographics
Offbeat Infographics
Parenting Infographics
Pets & Animals Infographics
Political Infographics
Shopping Infographics
Sports and Athletic Infographics
Technology Infographics
Transportation Infographics
Travel Infographics
Video Infographics