


Search 12,100+ Infographics!
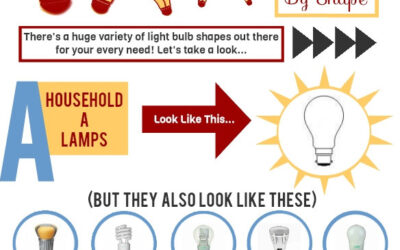
A Guide To Screw-In Light Bulbs (By Shape)
Who doesn’t appreciate a nice shape? That’s what this infographic is all about. (Light bulb shape that is). Take a delightful, illustrated journey through the thrilling world of screw-in light bulbs, the most popular light bulb variety by far. Learn how to differentiate all kinds of screw-in light bulbs from the standard household A-lamp to the more exotic light bulbs like globes, tubular lamps, and so many more.
The Image of Perfection
A recent survey conducted with over 1,000 men and women revealed the British perception of beauty and perfection in celebrities. The results, displayed in the MYA.co.uk infographic below show which celebrities have the best body parts and what the ‘perfect’ man and woman would potentially look like.

Selling Software to College Students
Did you know that 66% of students don’t realize they can get academic discounts on software? SheerID is here to help with the following infographic on how to successfully sell software to college students.
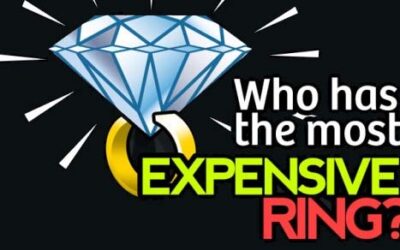
Top 10 Most Expensive Celebrity Engagement Rings
This educational and entertaining infographic from Brilliance reveals the top ten celebrity engagement rings arranged according to their price tag…and their equivalent amount in other Hollywood-related preoccupation.
Visual History of Cooper Black
You might not know it, but you’ve seen the Cooper Black font in use everywhere – in store-fronts, in magazines, on album covers and candy wrappers. This depression era novelty font gets around. And why wouldn’t it? It’s curvaceous and friendly, as the type designer who created this font said, “It’s a typeface for farsighted printers with nearsighted customers.”
How Do Teens Communicate
Today’s youth are the next generation of loyal customers. Those with jobs tend to have fewer financial responsibilities and more disposable income than older generations. To sell to them, it’s important to speak their language. AWeber surveyed 1,000 teens on their social media habits and published the following infographic with the findings.
The Most Influential People Made in the USA
The following infographic from Victor Pest Control takes a look at some of the world’s most influential people, all of who were “Made in the USA.”Learn who has made significant impacts on history both nationally and globally.
Low Carb Diet Myths and Misconceptions
The following infographic discusses some common myths and misconceptions associated with low carb lifestyle. Many people believe that these diets ban the consumption of carbohydrates, fruits and vegetables, and alcohol. Other misconceptions are that low carb diets raise cholesterol levels and cause different medical problems such as heart disease and kidney disease.
Direct Participation Oil Investments
Oil and gas investments can be somewhat complex for the average investor. This infographic by U.S. Oil Properties will explain the tax benefits of direct oil investments, how they are structured, as well as how the revenue is ultimately paid back to investors.
Super Berries
Many believe that berries are incredible superfoods that are beneficial for your health. In this infographic, you will find four heroic super berries listed along with information about how they can help protect you from the villainous clutches of free radicals.
A Guide To Screw-In Light Bulbs (By Shape)
Who doesn’t appreciate a nice shape? That’s what this infographic is all about. (Light bulb shape that is). Take a delightful, illustrated journey through the thrilling world of screw-in light bulbs, the most popular light bulb variety by far. Learn how to differentiate all kinds of screw-in light bulbs from the standard household A-lamp to the more exotic light bulbs like globes, tubular lamps, and so many more.
The Image of Perfection
A recent survey conducted with over 1,000 men and women revealed the British perception of beauty and perfection in celebrities. The results, displayed in the MYA.co.uk infographic below show which celebrities have the best body parts and what the ‘perfect’ man and woman would potentially look like.
Selling Software to College Students
Did you know that 66% of students don’t realize they can get academic discounts on software? SheerID is here to help with the following infographic on how to successfully sell software to college students.
Top 10 Most Expensive Celebrity Engagement Rings
This educational and entertaining infographic from Brilliance reveals the top ten celebrity engagement rings arranged according to their price tag…and their equivalent amount in other Hollywood-related preoccupation.
Visual History of Cooper Black
You might not know it, but you’ve seen the Cooper Black font in use everywhere – in store-fronts, in magazines, on album covers and candy wrappers. This depression era novelty font gets around. And why wouldn’t it? It’s curvaceous and friendly, as the type designer who created this font said, “It’s a typeface for farsighted printers with nearsighted customers.”
How Do Teens Communicate
Today’s youth are the next generation of loyal customers. Those with jobs tend to have fewer financial responsibilities and more disposable income than older generations. To sell to them, it’s important to speak their language. AWeber surveyed 1,000 teens on their social media habits and published the following infographic with the findings.
The Most Influential People Made in the USA
The following infographic from Victor Pest Control takes a look at some of the world’s most influential people, all of who were “Made in the USA.”Learn who has made significant impacts on history both nationally and globally.
Low Carb Diet Myths and Misconceptions
The following infographic discusses some common myths and misconceptions associated with low carb lifestyle. Many people believe that these diets ban the consumption of carbohydrates, fruits and vegetables, and alcohol. Other misconceptions are that low carb diets raise cholesterol levels and cause different medical problems such as heart disease and kidney disease.
Direct Participation Oil Investments
Oil and gas investments can be somewhat complex for the average investor. This infographic by U.S. Oil Properties will explain the tax benefits of direct oil investments, how they are structured, as well as how the revenue is ultimately paid back to investors.
Super Berries
Many believe that berries are incredible superfoods that are beneficial for your health. In this infographic, you will find four heroic super berries listed along with information about how they can help protect you from the villainous clutches of free radicals.
Partners


Browse Archives By Category
Animated Infographics
Business Infographics
Career & Jobs Infographics
Education Infographics
Entertainment Industry Infographics
Environmental Infographics
Finance & Money Infographics
Food & Drink Infographics
Health Infographics
Historical Infographics
Home & Garden Infographics
Internet Infographics
Law and Legal Infographics
Lifestyle Infographics
Marketing Infographics
Offbeat Infographics
Parenting Infographics
Pets & Animals Infographics
Political Infographics
Shopping Infographics
Sports and Athletic Infographics
Technology Infographics
Transportation Infographics
Travel Infographics
Video Infographics