


Search 12,100+ Infographics!

Caring and Tech: Nursing Homes of the Future
Caring and technology – the perfect balance to move things forward. Take a look at how these technologies are impacting the future of nursing homes, courtesy of The Wayne Center.
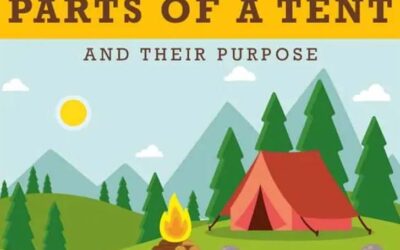
The Parts Of A Camping Tent Explained
When you are camping, your tent is your house. It gives you protection from the elements and privacy from those around you. But what do you know about how a tent is put together? Also, do you really know the different parts of a tent and their purpose? Here is an infographic describing the different parts of a camping tent and how they work.

The Curious World of Deleted Tweets
With political and socially acute topics dominating social media discussions, it’s easy to get caught up in the heat of the argument and say something you’ll regret later. It’s therefore not surprising how many people opt for deleting their old tweets. Tweet Deleter analyzed how 205 million tweets were erased by their users in 2020 and summarized these deleted tweets in the infographic.

How eCommerce Benefits from Product Configuration
Personalization has been a long touted feature of eCommerce, but using a product configurator – the true technology behind scalable customization makes it possible. Check out this infographic from PARTsolutions for a deep dive for more.
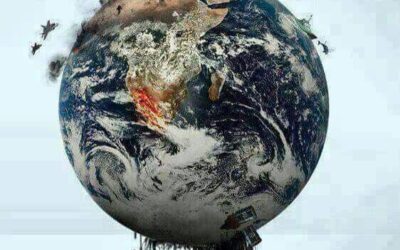
How Fast is the Planet Dying?
This sheet of depressing facts is brought to you by the team at PlaygroundEquipment.com. They sat down and combed through a bunch of environmental resources, papers and studies to come up with 26 statistics that are truly terrifying. From estimates on when fresh water will run out to facts about the extinction of our wild life, this information is scary and worrisome.
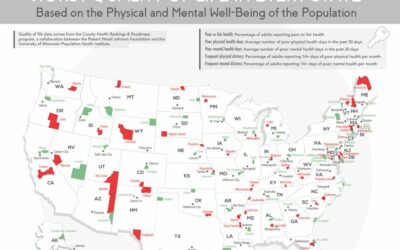
U.S. Counties With the Best and Worst Quality of Life in Every State
Here is a visual map that shows people are happiest and where people are the saddest for each state across the US. Following the research you can see many times that the happiest folk tend to be those living within the highest median income locations for that state and those with the worst quality of life tend to live in counties under or close to the poverty level.

6 Most Common Types of Allergies and Their Symptoms
Have you ever wondered why some people are allergic to some substances and others aren’t? If you are one of them, don’t worry you are not alone. According to the latest reports, more than 50 million Americans have experienced various types of allergies each year and allergies are one of the most common causes of chronic illness in the U.S. The following infographic walks you through the 6 most commonly seen allergies and their symptoms.

Vending Machines in Schools
The U.S. Department of Agriculture set standards for snacks and drinks sold during school hours. These nutritional guidelines are known as Smart Snacks in School. Snacks must have less than 200 calories, less than 35% saturated fat, 0 grams of trans fat and have...

Cleanliness: The Future of Nursing Homes
Cleanliness is so important in today’s physical world to keep people safe from COVID-19. All the more important in such places as nursing homes with some of the most susceptible people in society. Check out this visual deep dive on nursing home cleaning services.
A Chronology Of The GameStop Stock Surge
For a lot of people, what’s going on with GameStop’s stock doesn’t make sense. But it seems like the users of Reddit had revolted against the hedge funds playing down their favorite companies, leading them to sink by a billion dollars. In this infographic, GlobusBet shows the roller coaster of GameStop shares.
Caring and Tech: Nursing Homes of the Future
Caring and technology – the perfect balance to move things forward. Take a look at how these technologies are impacting the future of nursing homes, courtesy of The Wayne Center.
The Parts Of A Camping Tent Explained
When you are camping, your tent is your house. It gives you protection from the elements and privacy from those around you. But what do you know about how a tent is put together? Also, do you really know the different parts of a tent and their purpose? Here is an infographic describing the different parts of a camping tent and how they work.
The Curious World of Deleted Tweets
With political and socially acute topics dominating social media discussions, it’s easy to get caught up in the heat of the argument and say something you’ll regret later. It’s therefore not surprising how many people opt for deleting their old tweets. Tweet Deleter analyzed how 205 million tweets were erased by their users in 2020 and summarized these deleted tweets in the infographic.
How eCommerce Benefits from Product Configuration
Personalization has been a long touted feature of eCommerce, but using a product configurator – the true technology behind scalable customization makes it possible. Check out this infographic from PARTsolutions for a deep dive for more.
How Fast is the Planet Dying?
This sheet of depressing facts is brought to you by the team at PlaygroundEquipment.com. They sat down and combed through a bunch of environmental resources, papers and studies to come up with 26 statistics that are truly terrifying. From estimates on when fresh water will run out to facts about the extinction of our wild life, this information is scary and worrisome.
U.S. Counties With the Best and Worst Quality of Life in Every State
Here is a visual map that shows people are happiest and where people are the saddest for each state across the US. Following the research you can see many times that the happiest folk tend to be those living within the highest median income locations for that state and those with the worst quality of life tend to live in counties under or close to the poverty level.
6 Most Common Types of Allergies and Their Symptoms
Have you ever wondered why some people are allergic to some substances and others aren’t? If you are one of them, don’t worry you are not alone. According to the latest reports, more than 50 million Americans have experienced various types of allergies each year and allergies are one of the most common causes of chronic illness in the U.S. The following infographic walks you through the 6 most commonly seen allergies and their symptoms.
Vending Machines in Schools
The U.S. Department of Agriculture set standards for snacks and drinks sold during school hours. These nutritional guidelines are known as Smart Snacks in School. Snacks must have less than 200 calories, less than 35% saturated fat, 0 grams of trans fat and have...
Cleanliness: The Future of Nursing Homes
Cleanliness is so important in today’s physical world to keep people safe from COVID-19. All the more important in such places as nursing homes with some of the most susceptible people in society. Check out this visual deep dive on nursing home cleaning services.
A Chronology Of The GameStop Stock Surge
For a lot of people, what’s going on with GameStop’s stock doesn’t make sense. But it seems like the users of Reddit had revolted against the hedge funds playing down their favorite companies, leading them to sink by a billion dollars. In this infographic, GlobusBet shows the roller coaster of GameStop shares.
Partners


Browse Archives By Category
Animated Infographics
Business Infographics
Career & Jobs Infographics
Education Infographics
Entertainment Industry Infographics
Environmental Infographics
Finance & Money Infographics
Food & Drink Infographics
Health Infographics
Historical Infographics
Home & Garden Infographics
Internet Infographics
Law and Legal Infographics
Lifestyle Infographics
Marketing Infographics
Offbeat Infographics
Parenting Infographics
Pets & Animals Infographics
Political Infographics
Shopping Infographics
Sports and Athletic Infographics
Technology Infographics
Transportation Infographics
Travel Infographics
Video Infographics