


Search 12,100+ Infographics!
100 Years of Automotive Evolution
It is incredibly easy to take automotive advancement for granted. After all, drivers today are enjoying amazingly luxurious vehicles without any knowledge of “how things used to be”. It’s an understandable dynamic, but for fun, and obviously perspective, it can be beneficial to take a look back on where our cars and trucks truly originated, and, even if for a moment, reflect on how far things have come in the last 100 years of automotive engineering.
Low Back Pain with Sciatica
Low back pain with sciatica is among the most common medical conditions. Learn more about the causes, warning signs, some prevention tips and the most effective treatment options in this infographic published by Mount Sinai Medical Center.
Interesting Facts on Pregnancy Nutrition
Did you know that Australian women on average don’t get enough important nutrients they need during pregnancy? Because it can oftentimes be difficult to get all the additional nutrients needed during pregnancy, dietary supplements might be the order for good pregnancy nutrition. Find out some interesting facts on pregnancy nutrition in the following infographic.
25 Years of Shark Week
There’s a lot to celebrate for a quadrancentennial. Not only has Shark Week been around for 25 years, but it has been one of Discovery Channel’s most popular programs with over 30 million viewers. So go ahead, take a bite out of this infographic published by Lemon.ly.

Are Target Date Funds a Good Choice?
Investing in a target date fund seems like the easy answer to retirement planning. But how can a single fund be appropriate for thousands of investors. Check out this infographic to see the limitations of target date funds.

San Francisco’s Best Kept Secrets
Are you visiting San Fran but don’t want it to look like you are a tourist? There’s more to San Francisco than the Golden Gate Bridge and Fisherman’s Wharf. Get the inside scoop on the Bay City’s best oysters, Mai Tai’s, tips on traveling around the city, and more in Marriott’s infographic “Travel Like a Local: San Francisco’s Best-Kept Secrets.”
New York City’s Five Boroughs
Did you know that Staten Island was named after the Dutch Parliament? Or the Bronx zoo is the largest metro zoo in the US? The Five New York City Boroughs are full of dramatic history, fantastic sights, famous eats, and attractions galore. The following infographic published by Marriott will give you a history lesson and also some modern day tips.
How a Bad Infographic Can Ruin Your Business
Infographics are all the rage these days. The good news is that more and more businesses are waking up and seeing the benefits that good infographics can have on their marketing efforts as well as branding visibility. Unfortunately, the infographic market has become saturated with, how do I say this… bad infographics.
Wondering About a Vegan Diet?
A vegan diet can be healthy and simple. If a slim waistline, lots of energy, and a reduced risk of heart disease, diabetes and cancer have you wondering if a vegan diet is for you, you’ll discovers all the answers in the following infographic from PETA.
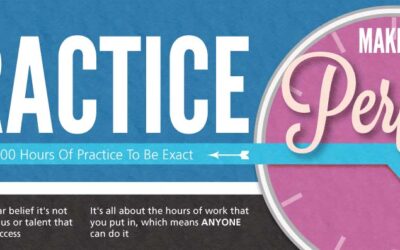
Practice Makes Perfect
Apparently, being born with a natural talent isn’t enough. While we’d like to label certain individuals as having natural abilities, the truth of the matter is a lot of practice came into play for them to reach their full potential. Don’t believe us? Our friends at Zintro have an infographic that gives all the details explaining how to really perfect your craft.
100 Years of Automotive Evolution
It is incredibly easy to take automotive advancement for granted. After all, drivers today are enjoying amazingly luxurious vehicles without any knowledge of “how things used to be”. It’s an understandable dynamic, but for fun, and obviously perspective, it can be beneficial to take a look back on where our cars and trucks truly originated, and, even if for a moment, reflect on how far things have come in the last 100 years of automotive engineering.
Low Back Pain with Sciatica
Low back pain with sciatica is among the most common medical conditions. Learn more about the causes, warning signs, some prevention tips and the most effective treatment options in this infographic published by Mount Sinai Medical Center.
Interesting Facts on Pregnancy Nutrition
Did you know that Australian women on average don’t get enough important nutrients they need during pregnancy? Because it can oftentimes be difficult to get all the additional nutrients needed during pregnancy, dietary supplements might be the order for good pregnancy nutrition. Find out some interesting facts on pregnancy nutrition in the following infographic.
25 Years of Shark Week
There’s a lot to celebrate for a quadrancentennial. Not only has Shark Week been around for 25 years, but it has been one of Discovery Channel’s most popular programs with over 30 million viewers. So go ahead, take a bite out of this infographic published by Lemon.ly.
Are Target Date Funds a Good Choice?
Investing in a target date fund seems like the easy answer to retirement planning. But how can a single fund be appropriate for thousands of investors. Check out this infographic to see the limitations of target date funds.
San Francisco’s Best Kept Secrets
Are you visiting San Fran but don’t want it to look like you are a tourist? There’s more to San Francisco than the Golden Gate Bridge and Fisherman’s Wharf. Get the inside scoop on the Bay City’s best oysters, Mai Tai’s, tips on traveling around the city, and more in Marriott’s infographic “Travel Like a Local: San Francisco’s Best-Kept Secrets.”
New York City’s Five Boroughs
Did you know that Staten Island was named after the Dutch Parliament? Or the Bronx zoo is the largest metro zoo in the US? The Five New York City Boroughs are full of dramatic history, fantastic sights, famous eats, and attractions galore. The following infographic published by Marriott will give you a history lesson and also some modern day tips.
How a Bad Infographic Can Ruin Your Business
Infographics are all the rage these days. The good news is that more and more businesses are waking up and seeing the benefits that good infographics can have on their marketing efforts as well as branding visibility. Unfortunately, the infographic market has become saturated with, how do I say this… bad infographics.
Wondering About a Vegan Diet?
A vegan diet can be healthy and simple. If a slim waistline, lots of energy, and a reduced risk of heart disease, diabetes and cancer have you wondering if a vegan diet is for you, you’ll discovers all the answers in the following infographic from PETA.
Practice Makes Perfect
Apparently, being born with a natural talent isn’t enough. While we’d like to label certain individuals as having natural abilities, the truth of the matter is a lot of practice came into play for them to reach their full potential. Don’t believe us? Our friends at Zintro have an infographic that gives all the details explaining how to really perfect your craft.
Partners


Browse Archives By Category
Animated Infographics
Business Infographics
Career & Jobs Infographics
Education Infographics
Entertainment Industry Infographics
Environmental Infographics
Finance & Money Infographics
Food & Drink Infographics
Health Infographics
Historical Infographics
Home & Garden Infographics
Internet Infographics
Law and Legal Infographics
Lifestyle Infographics
Marketing Infographics
Offbeat Infographics
Parenting Infographics
Pets & Animals Infographics
Political Infographics
Shopping Infographics
Sports and Athletic Infographics
Technology Infographics
Transportation Infographics
Travel Infographics
Video Infographics