


Search 12,100+ Infographics!
Internet Marketing Land
This infographic, published by David McBee, describes the pros and cons of some of the most popular internet marketing channels, including social media sites Facebook, Twitter, Google+ and LinkedIn as well as internet marketing tactics such as SEO, Pay Per Click and Video Marketing.

What Does It Take to Create Effective e-Learning?
The following infographic from Leanforward highlights the five key skill sets required to develop effective elearning as well as the primary contributions of each team member.
Tips for Heart Health and Heart Disease Prevention
Learn how to keep your heart healthy with this heart disease prevention infographic from Sunrise Hospital and Medical Center. Get the inside scoop on heart disease risk factors and learn what you can do to stay healthy!
Killing Time: How to Destroy Your Productivity
A study at The British Institute of Psychiatry showed that checking your email while performing another creative task decreases your IQ in the moment by 10 points. That is the equivalent of not sleeping for 36 hours. This mundane task is just one of many everyday work habits that may be standing in the way of your company’s efforts to boost productivity and increase sales. Infographic by Marketo.
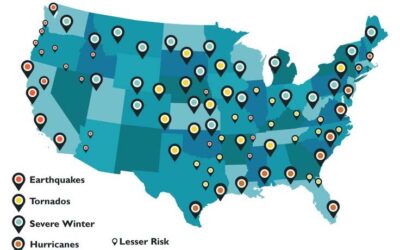
Small Business Disaster Preparedness
This infographic creates awareness for organizations to properly plan for disaster, small business disaster recovery, and hopes helps puts the related risks into perspective.
Olympics 2012: What’s The Impact?
This infographic presented by Click Software highlights some of the impacts that the Summer 2012 Olympics will have on London.
Impact of the Internet and Social Media on Travel Industry
The infographic by funsherpa looks at the influence of social media on travelers, how travelers use the internet, and how social media has become a major part of the vacation.

What’s in Your Hot Dog?
This summer, Applegate has invited people across the country to confront that haunting question: What’s in Your Hot Dog? While the answer can be scary, once you’ve found a well-made dog, the fun begins and you can focus on what to put on your hot dog in order to maximize deliciousness. This infographic helps to guide this doggy discovery process and make it more fun.
Future of RFID
This infographic visualizes the future of RFID. Take a ride along the path of adoption, convergence, the Internet of things, and big data – ending in a place where RFID systems will become an integral part of the consumer and business experience.
Zombie Attack! What You Need to Know
The zombie apocalypse has arrived, and now we need some folks to come along with their mighty boom-sticks and clear up all this mess. That’s where you come in. Below the infographic by BuyaGift.com offers a whole new range of zombie experience days, ready to train you for the inevitable zombie onslaught.
Internet Marketing Land
This infographic, published by David McBee, describes the pros and cons of some of the most popular internet marketing channels, including social media sites Facebook, Twitter, Google+ and LinkedIn as well as internet marketing tactics such as SEO, Pay Per Click and Video Marketing.
What Does It Take to Create Effective e-Learning?
The following infographic from Leanforward highlights the five key skill sets required to develop effective elearning as well as the primary contributions of each team member.
Tips for Heart Health and Heart Disease Prevention
Learn how to keep your heart healthy with this heart disease prevention infographic from Sunrise Hospital and Medical Center. Get the inside scoop on heart disease risk factors and learn what you can do to stay healthy!
Killing Time: How to Destroy Your Productivity
A study at The British Institute of Psychiatry showed that checking your email while performing another creative task decreases your IQ in the moment by 10 points. That is the equivalent of not sleeping for 36 hours. This mundane task is just one of many everyday work habits that may be standing in the way of your company’s efforts to boost productivity and increase sales. Infographic by Marketo.
Small Business Disaster Preparedness
This infographic creates awareness for organizations to properly plan for disaster, small business disaster recovery, and hopes helps puts the related risks into perspective.
Olympics 2012: What’s The Impact?
This infographic presented by Click Software highlights some of the impacts that the Summer 2012 Olympics will have on London.
Impact of the Internet and Social Media on Travel Industry
The infographic by funsherpa looks at the influence of social media on travelers, how travelers use the internet, and how social media has become a major part of the vacation.
What’s in Your Hot Dog?
This summer, Applegate has invited people across the country to confront that haunting question: What’s in Your Hot Dog? While the answer can be scary, once you’ve found a well-made dog, the fun begins and you can focus on what to put on your hot dog in order to maximize deliciousness. This infographic helps to guide this doggy discovery process and make it more fun.
Future of RFID
This infographic visualizes the future of RFID. Take a ride along the path of adoption, convergence, the Internet of things, and big data – ending in a place where RFID systems will become an integral part of the consumer and business experience.
Zombie Attack! What You Need to Know
The zombie apocalypse has arrived, and now we need some folks to come along with their mighty boom-sticks and clear up all this mess. That’s where you come in. Below the infographic by BuyaGift.com offers a whole new range of zombie experience days, ready to train you for the inevitable zombie onslaught.
Partners


Browse Archives By Category
Animated Infographics
Business Infographics
Career & Jobs Infographics
Education Infographics
Entertainment Industry Infographics
Environmental Infographics
Finance & Money Infographics
Food & Drink Infographics
Health Infographics
Historical Infographics
Home & Garden Infographics
Internet Infographics
Law and Legal Infographics
Lifestyle Infographics
Marketing Infographics
Offbeat Infographics
Parenting Infographics
Pets & Animals Infographics
Political Infographics
Shopping Infographics
Sports and Athletic Infographics
Technology Infographics
Transportation Infographics
Travel Infographics
Video Infographics