


Search 12,100+ Infographics!
Growing Up As The Class Of 2012
Modern life is very different for the class of 2012 than it has been for any prior generation. This infographic highlights some of the facets of modern life that the newest generation may take for granted, including instant messaging, online shopping, smartphones, high speed wireless internet, etc. It clearly shows how the class of 2012 utilizes technology on a daily basis, more so than any other generation.
What’s Really In Your Pet’s Food?
Did you know that the dog’s basic physiology hasn’t changed in hundreds of years? It only makes sense to base a dog’s diet on what canine ancestors ate–a balance of protein, fats, and carbohydrates. Yet, modern pet foods have substantially changed what our dogs eat. To learn more about optimum canine health (and other dog food facts), take a look at the following infographic.

The Biggest Moves in History
Every time I hear about someone having to move, I cringe. I’ll be honest – not only do I NOT want to help but I also think about the horror if I ever had to move again (we have too much stuff). Are you in the same boat? Well you are not alone and will probably feel like your next move is a piece of cake after seeing some of the biggest moves in history, all laid out nicely in the following infographic from VanLines.com.
The Business Marketers’ Guide to Instagram
Instagram is on the bullet train for total photo-marketing domination, and with its user base expanding faster than the universe, it provides a cornucopia of opportunity for B2B marketing. Its simplicity allows for a wide variety of applications and it is quickly becoming an essential element to any successful visual content marketing strategy.
In this infographic from Marketo we explore the budding social photo-sharing site turned marketing platform and how it can give your company an edge in generating leads and promoting your brand.
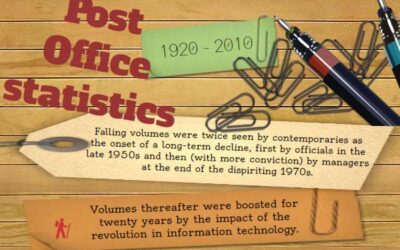
Stamp Price Rises 2012
The following infographic from Quadient outlines a few reasons as to why Royal Mail (UK) stamp prices have risen and some solutions that both individuals and companies can take advantage of to tackle the issue.
Sensible Social Media Checklist for Businesses v2.0
Want to spend less time on social media and get more business out of it? This handy social media checklist from the Smart Inbound Marketing Team at The Whole Brain Group helps businesses take a sensible approach to setting goals on the most popular social media networks, including Pinterest, YouTube, Google+, Facebook, LinkedIn, and Twitter!
The Lead-To-Revenue Performance Framework Explained
The following infographic from Marketo provides a visual representation of how marketers can make the most of their Lead to Revenue Management investments. Lead-to-revenue management is a set of disciplines that can be strongly supported by marketing automation.

How to Beat Stress at the Office
By being aware of stress tipping points, businesses can follow some basic steps to reduce anxiety and become a more successful business. The infographic below will describe how Hiscox has developed some guidance with the help of Physiologist Donna Dawson so that businesses can understand how to address these issues.
Diesel Engine Shootout: Ford vs Chevy vs Dodge
America’s big three auto manufacturers have been battling it out for decades. In the last few years, they’ve taken their diesel rigs to the next level. Serious improvements have been made to the engines, making them more capable than ever. The following infographic breaks down the differences so you can understand the differences and see how each engine performs.

Movie & Television T-Shirt Anthology
Not so much an infographic in my opinion but I thought I’d post this here simply because it is fun. It features movie characters wearing t-shirts from 55 different movies and/or television shows through out the years. Can you guess who each person is? Answers are at the bottom but don’t cheat!
Growing Up As The Class Of 2012
Modern life is very different for the class of 2012 than it has been for any prior generation. This infographic highlights some of the facets of modern life that the newest generation may take for granted, including instant messaging, online shopping, smartphones, high speed wireless internet, etc. It clearly shows how the class of 2012 utilizes technology on a daily basis, more so than any other generation.
What’s Really In Your Pet’s Food?
Did you know that the dog’s basic physiology hasn’t changed in hundreds of years? It only makes sense to base a dog’s diet on what canine ancestors ate–a balance of protein, fats, and carbohydrates. Yet, modern pet foods have substantially changed what our dogs eat. To learn more about optimum canine health (and other dog food facts), take a look at the following infographic.
The Biggest Moves in History
Every time I hear about someone having to move, I cringe. I’ll be honest – not only do I NOT want to help but I also think about the horror if I ever had to move again (we have too much stuff). Are you in the same boat? Well you are not alone and will probably feel like your next move is a piece of cake after seeing some of the biggest moves in history, all laid out nicely in the following infographic from VanLines.com.
The Business Marketers’ Guide to Instagram
Instagram is on the bullet train for total photo-marketing domination, and with its user base expanding faster than the universe, it provides a cornucopia of opportunity for B2B marketing. Its simplicity allows for a wide variety of applications and it is quickly becoming an essential element to any successful visual content marketing strategy.
In this infographic from Marketo we explore the budding social photo-sharing site turned marketing platform and how it can give your company an edge in generating leads and promoting your brand.
Stamp Price Rises 2012
The following infographic from Quadient outlines a few reasons as to why Royal Mail (UK) stamp prices have risen and some solutions that both individuals and companies can take advantage of to tackle the issue.
Sensible Social Media Checklist for Businesses v2.0
Want to spend less time on social media and get more business out of it? This handy social media checklist from the Smart Inbound Marketing Team at The Whole Brain Group helps businesses take a sensible approach to setting goals on the most popular social media networks, including Pinterest, YouTube, Google+, Facebook, LinkedIn, and Twitter!
The Lead-To-Revenue Performance Framework Explained
The following infographic from Marketo provides a visual representation of how marketers can make the most of their Lead to Revenue Management investments. Lead-to-revenue management is a set of disciplines that can be strongly supported by marketing automation.
How to Beat Stress at the Office
By being aware of stress tipping points, businesses can follow some basic steps to reduce anxiety and become a more successful business. The infographic below will describe how Hiscox has developed some guidance with the help of Physiologist Donna Dawson so that businesses can understand how to address these issues.
Diesel Engine Shootout: Ford vs Chevy vs Dodge
America’s big three auto manufacturers have been battling it out for decades. In the last few years, they’ve taken their diesel rigs to the next level. Serious improvements have been made to the engines, making them more capable than ever. The following infographic breaks down the differences so you can understand the differences and see how each engine performs.
Movie & Television T-Shirt Anthology
Not so much an infographic in my opinion but I thought I’d post this here simply because it is fun. It features movie characters wearing t-shirts from 55 different movies and/or television shows through out the years. Can you guess who each person is? Answers are at the bottom but don’t cheat!
Partners


Browse Archives By Category
Animated Infographics
Business Infographics
Career & Jobs Infographics
Education Infographics
Entertainment Industry Infographics
Environmental Infographics
Finance & Money Infographics
Food & Drink Infographics
Health Infographics
Historical Infographics
Home & Garden Infographics
Internet Infographics
Law and Legal Infographics
Lifestyle Infographics
Marketing Infographics
Offbeat Infographics
Parenting Infographics
Pets & Animals Infographics
Political Infographics
Shopping Infographics
Sports and Athletic Infographics
Technology Infographics
Transportation Infographics
Travel Infographics
Video Infographics