


Search 12,100+ Infographics!
History of Interior Design
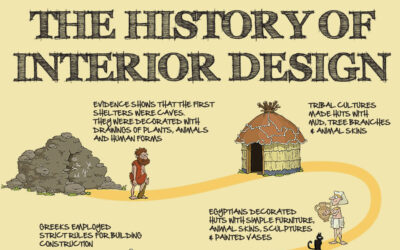
Everyone wants their homes to look nice. Whether it be painted or mosaic walls, rich, ornate furniture or bright, bold prints, people through the ages have decorated their homes to improve home décor, and in that respect, not much has changed since cavemen painted their caves. How have people decorated their homes through the ages?
Top House Plan Styles by State
Houseplans.com took a look at the most sought-after architectural styles in each state and discovered that the Craftsman home plans are not only popular across all age groups, but remain a top choice from one end of the country to the other. This infographic highlights what was found and explores the origins of the nation’s top home design styles.
Google Panda Update Up Close
The following infographic from SEO.com goes into detail about the timeline of Google’s Panda update to the search algorithm. They also go into about ways to help your site in Google Search with actions to take on your site.

Fire Safety on the 4th of July
There are typically more fires reported on July 4th than any other day of the year. Plus, thousands of BBQ-attendees are sent to the emergency room each year due to holiday-related injuries. Don’t skip the party! Just be aware of these July 4th safety tips as you celebrate.

Happy Independence Day!
Independence Day also known as “4th of July” is considered to be one of the most important holidays in U.S. as it celebrates the publication of the declaration of independence from Great Britain in 1776. The following infographic takes a look at numbers behind the 4th of July.

An Explosive Display: Fun on the 4th
It’s July 4th again! Check out this infographic from Military VA Loan which includes some interesting facts about how we get our flags, how the 4th is actually the most dangerous driving day of the year, and more. No matter what, make sure you have a safe and fun holiday celebrating America’s history.
The Great App-splosion
Businesses are always looking for new ways to become more efficient. Smart phones started the mobility wave and now tablets are keeping it going. Tablets are growing in popularity among businesses, especially large ones. Take a look at this infographic presented by Click Software that illustrates how tablets and app development is blowing up the mobile market.
How Designers Can Deal With a Creative Block
Creative Block is known to render one useless. It’s feared and dreaded by all creative individuals. Even graphic and logo designers are prone to this. This infographic provides info regarding the causes of creative block and 10 fun stress busting ways.
Is Google Plus a Failure?
Google+, a bit late to the social media game, but there none the less. And with Google seeming to be pushing it very hard from every angle, how is the future looking for Google +? Find out now, in a hypothetical conversation from a post apocalypic future, created by Browser Media.
The Kitchen Remodeling Process: Start to Finish
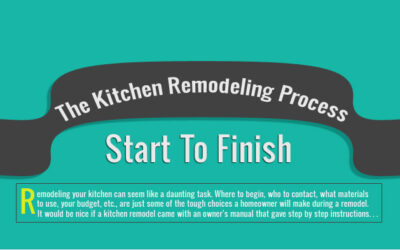
In this infographic, Palatin Remodeling provides us a fun, detailed representation of the general process that a homeowner should experience when remodeling their kitchen with a contractor.
History of Interior Design
Everyone wants their homes to look nice. Whether it be painted or mosaic walls, rich, ornate furniture or bright, bold prints, people through the ages have decorated their homes to improve home décor, and in that respect, not much has changed since cavemen painted their caves. How have people decorated their homes through the ages?
Top House Plan Styles by State
Houseplans.com took a look at the most sought-after architectural styles in each state and discovered that the Craftsman home plans are not only popular across all age groups, but remain a top choice from one end of the country to the other. This infographic highlights what was found and explores the origins of the nation’s top home design styles.
Google Panda Update Up Close
The following infographic from SEO.com goes into detail about the timeline of Google’s Panda update to the search algorithm. They also go into about ways to help your site in Google Search with actions to take on your site.
Fire Safety on the 4th of July
There are typically more fires reported on July 4th than any other day of the year. Plus, thousands of BBQ-attendees are sent to the emergency room each year due to holiday-related injuries. Don’t skip the party! Just be aware of these July 4th safety tips as you celebrate.
Happy Independence Day!
Independence Day also known as “4th of July” is considered to be one of the most important holidays in U.S. as it celebrates the publication of the declaration of independence from Great Britain in 1776. The following infographic takes a look at numbers behind the 4th of July.
An Explosive Display: Fun on the 4th
It’s July 4th again! Check out this infographic from Military VA Loan which includes some interesting facts about how we get our flags, how the 4th is actually the most dangerous driving day of the year, and more. No matter what, make sure you have a safe and fun holiday celebrating America’s history.
The Great App-splosion
Businesses are always looking for new ways to become more efficient. Smart phones started the mobility wave and now tablets are keeping it going. Tablets are growing in popularity among businesses, especially large ones. Take a look at this infographic presented by Click Software that illustrates how tablets and app development is blowing up the mobile market.
How Designers Can Deal With a Creative Block
Creative Block is known to render one useless. It’s feared and dreaded by all creative individuals. Even graphic and logo designers are prone to this. This infographic provides info regarding the causes of creative block and 10 fun stress busting ways.
Is Google Plus a Failure?
Google+, a bit late to the social media game, but there none the less. And with Google seeming to be pushing it very hard from every angle, how is the future looking for Google +? Find out now, in a hypothetical conversation from a post apocalypic future, created by Browser Media.
The Kitchen Remodeling Process: Start to Finish
In this infographic, Palatin Remodeling provides us a fun, detailed representation of the general process that a homeowner should experience when remodeling their kitchen with a contractor.
Partners


Browse Archives By Category
Animated Infographics
Business Infographics
Career & Jobs Infographics
Education Infographics
Entertainment Industry Infographics
Environmental Infographics
Finance & Money Infographics
Food & Drink Infographics
Health Infographics
Historical Infographics
Home & Garden Infographics
Internet Infographics
Law and Legal Infographics
Lifestyle Infographics
Marketing Infographics
Offbeat Infographics
Parenting Infographics
Pets & Animals Infographics
Political Infographics
Shopping Infographics
Sports and Athletic Infographics
Technology Infographics
Transportation Infographics
Travel Infographics
Video Infographics