


Search 12,100+ Infographics!
Online Shopping VS Offline Shopping
This infographic from Grazia Fashion shows that women have a clear preference to shopping in the “real world” rather than shopping on the internet. This is because women can feel the product and they don’t like to wait until the product arrives.
Get Nuts
I love nuts of all kinds, almonds being one of my favorites but nit to forget pistachios, pecans, pine nuts and even good old fashion circus peanuts. That’s why I thought it was cool when I ran across this infographic which provides all sorts of interesting facts about nuts.

How to Become a Dental Assistant
Dental assistants assist the dentist in order to provide more efficient treatment to patients, by preparing the patient for dental treatment, sterilizing various dental instruments, holding a suction device, taking teeth impressions, and fabricating provisional crowns. By having dental assistants, dentists are able increase their concentration on the actual procedure. The following infographic provides information on how to go about a dental assistant career.

How to Become a Medical Assistant
Medical assistants perform variety of job duties in health management field as they are equipped with fundamental knowledge of medical sciences like anatomy, pathology, physiology and medical terminology. However, duties vary with the specialty, location and size of the practice. The following infographic will help you to learn more about a medical assistant career.
Why Is My Cubicle Trying To Kill Me?
Just another day at the office? While life in your cubicle may seem completely ordinary, there could be any number of dangers lurking just around the corner. The following infographic from Suncorp Insurance looks at why your work cubicle might be trying to kill you.
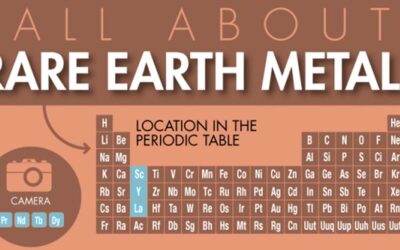
All About Rare Earth Metals
Rare Earth Metals are a geopolitical issue, which causes issues not only for companies, but also entire countries. Rare Earth metals get mostly harvested in China, which controls more than 90% of the market. Japan, Europe and the US have a high demand in these metals for their car, cell phone production.
Universal Orlando: Where To Stay, What To Do
Universal Orlando Resort – another great place to vacation while visiting Orlando. Travelers can stay on-property at one of Universal’s great hotels or stay on the famous International Drive. Staying on International Drive, you will find so much to do when the parks close, plus the selection of restaurants and shops increases exponentially.

Atari: 40 Years of Fun!
I still remember the days growing up as a kid and playing Atari games such as Pong, Asteroids and one of my all-time favorites, Centipede. Being the old guy that I am now, I still favor those games over today’s virtual reality types of games. When I cam across this Atari timeline infographic at Mashable, I just had to post it here.
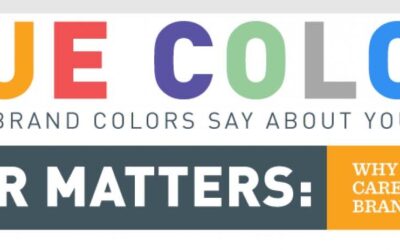
True Colors: What Your Brand Colors Say About Your Business
The most prominent brands in the world are defined by their colors. Think of McDonald’s golden arches, the name Jet Blue, and UPS’ slogan, “What can Brown do for you?” These companies, and many others, strategically use colors in their logo, website, and product to appeal to customers. As a B2B marketer, it’s important to think about how you utilize colors and what the colors you choose say about your business.

The History of Window Blinds
Window covers may often be overlooked when designing a home but they are a very important element to maintain comfortable temperatures in a living space. Through time, blinds have been used to improve the quality of life in homes. The following infographic from Blindsgalore that takes us through the history and development of window covers.
Online Shopping VS Offline Shopping
This infographic from Grazia Fashion shows that women have a clear preference to shopping in the “real world” rather than shopping on the internet. This is because women can feel the product and they don’t like to wait until the product arrives.
Get Nuts
I love nuts of all kinds, almonds being one of my favorites but nit to forget pistachios, pecans, pine nuts and even good old fashion circus peanuts. That’s why I thought it was cool when I ran across this infographic which provides all sorts of interesting facts about nuts.
How to Become a Dental Assistant
Dental assistants assist the dentist in order to provide more efficient treatment to patients, by preparing the patient for dental treatment, sterilizing various dental instruments, holding a suction device, taking teeth impressions, and fabricating provisional crowns. By having dental assistants, dentists are able increase their concentration on the actual procedure. The following infographic provides information on how to go about a dental assistant career.
How to Become a Medical Assistant
Medical assistants perform variety of job duties in health management field as they are equipped with fundamental knowledge of medical sciences like anatomy, pathology, physiology and medical terminology. However, duties vary with the specialty, location and size of the practice. The following infographic will help you to learn more about a medical assistant career.
Why Is My Cubicle Trying To Kill Me?
Just another day at the office? While life in your cubicle may seem completely ordinary, there could be any number of dangers lurking just around the corner. The following infographic from Suncorp Insurance looks at why your work cubicle might be trying to kill you.
All About Rare Earth Metals
Rare Earth Metals are a geopolitical issue, which causes issues not only for companies, but also entire countries. Rare Earth metals get mostly harvested in China, which controls more than 90% of the market. Japan, Europe and the US have a high demand in these metals for their car, cell phone production.
Universal Orlando: Where To Stay, What To Do
Universal Orlando Resort – another great place to vacation while visiting Orlando. Travelers can stay on-property at one of Universal’s great hotels or stay on the famous International Drive. Staying on International Drive, you will find so much to do when the parks close, plus the selection of restaurants and shops increases exponentially.
Atari: 40 Years of Fun!
I still remember the days growing up as a kid and playing Atari games such as Pong, Asteroids and one of my all-time favorites, Centipede. Being the old guy that I am now, I still favor those games over today’s virtual reality types of games. When I cam across this Atari timeline infographic at Mashable, I just had to post it here.
True Colors: What Your Brand Colors Say About Your Business
The most prominent brands in the world are defined by their colors. Think of McDonald’s golden arches, the name Jet Blue, and UPS’ slogan, “What can Brown do for you?” These companies, and many others, strategically use colors in their logo, website, and product to appeal to customers. As a B2B marketer, it’s important to think about how you utilize colors and what the colors you choose say about your business.
The History of Window Blinds
Window covers may often be overlooked when designing a home but they are a very important element to maintain comfortable temperatures in a living space. Through time, blinds have been used to improve the quality of life in homes. The following infographic from Blindsgalore that takes us through the history and development of window covers.
Partners


Browse Archives By Category
Animated Infographics
Business Infographics
Career & Jobs Infographics
Education Infographics
Entertainment Industry Infographics
Environmental Infographics
Finance & Money Infographics
Food & Drink Infographics
Health Infographics
Historical Infographics
Home & Garden Infographics
Internet Infographics
Law and Legal Infographics
Lifestyle Infographics
Marketing Infographics
Offbeat Infographics
Parenting Infographics
Pets & Animals Infographics
Political Infographics
Shopping Infographics
Sports and Athletic Infographics
Technology Infographics
Transportation Infographics
Travel Infographics
Video Infographics