


Search 12,100+ Infographics!

The Green Warehouse Effect
This “The Green Warehouse Effect” infographic showcases ways to improve sustainability in a warehouse and provides details on ways warehouses can update their building to lower energy costs, and become more sustainable. This infographic includes statistics about energy use in warehouses, and simple ways to recycle, reuse, and reduce.
Gambling and the USA National Debt
The national debt is obviously a problem. A $15.7 trillion problem to be exact. Yet, it seems not much is being done to change it. So the question is, could online gambling be a solution for the USA’s national debt? This infographic presented by casino.org highlights the benefits of gambling in the US and how it very well could help with our staggering national debt.

Living Legacy of African American Music
June is officially African-American Music Appreciation Month. In light of this, GMR teamed up with the Rock and Roll Hall of Fame to produce the following infographic which showcases the contributions of some of the finest musicians in American history.
Facts About Diamonds
Diamonds have long been valued by people. We value them for many reasons including as a commodity, as a sign of love and also as a status symbol. The infographic below has many useful gems if information that will perhaps explain why we put so much value on these trinkets.
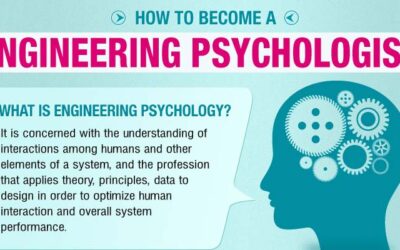
How to Become an Engineering Psychologist
Engineering psychologists mainly specialize in developing safer and user-friendly products. Engineering psychology emerged during the World War II in 1940’s, as many traditional engineers began considering user factors when designing new products and programs. A career in engineering psychology would be ideal match for you if you enjoy designing and improving products to meet end-user’s needs.

How To Become A Speech-Language Pathologist
This infographic reveals the requirements to become a speech therapist in the US. Found within are the steps necessary for high school students to obtain a career in the speech therapy field. The student will be able to quickly understand the educational and career requirements. There is also a good overview of the job outlook for speech pathologists located in the United States.
Best Time to Buy a Car
When is the best time to buy a car? The infographic from FindtheBestCarPrice.com highlights what cars to buy in different seasons, the best time of the year, month, and day to buy a car.
Mobile Dependence: A Growing Trend in Business Travel
According to stats from PC Housing, smartphones and tablets are slowly placing themselves in between water and food as top necessities for business travelers. It makes sense. Being on the road is simply made easier and more manageable by these tools that allow us to stay connected but are these mobile devices taking up too much of our time?
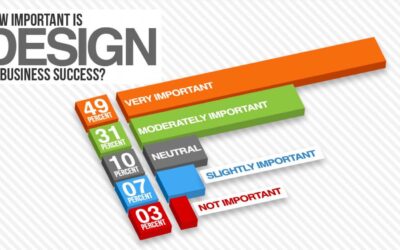
Does Design Matter?
Many business and technology pundits say that design is becoming an increasingly important factor in the success of companies these days, but does that sentiment trickle down to the people actually running small businesses and deciding how much emphasis to place on design work?. 99designs surveyed 1,500 small businesses and start-ups to better understand the changing role of design in the business world.
Infographics Defined
It seems that infographics are everywhere you look these days. Many of the major tech sites feature them daily. Friends Tweet them and post them on their Facebook walls. However, its still surprising how many people don’t know what they are, how they are made or why they are so important for marketing. Here is an “infographic about infographics.”
The Green Warehouse Effect
This “The Green Warehouse Effect” infographic showcases ways to improve sustainability in a warehouse and provides details on ways warehouses can update their building to lower energy costs, and become more sustainable. This infographic includes statistics about energy use in warehouses, and simple ways to recycle, reuse, and reduce.
Gambling and the USA National Debt
The national debt is obviously a problem. A $15.7 trillion problem to be exact. Yet, it seems not much is being done to change it. So the question is, could online gambling be a solution for the USA’s national debt? This infographic presented by casino.org highlights the benefits of gambling in the US and how it very well could help with our staggering national debt.
Living Legacy of African American Music
June is officially African-American Music Appreciation Month. In light of this, GMR teamed up with the Rock and Roll Hall of Fame to produce the following infographic which showcases the contributions of some of the finest musicians in American history.
Facts About Diamonds
Diamonds have long been valued by people. We value them for many reasons including as a commodity, as a sign of love and also as a status symbol. The infographic below has many useful gems if information that will perhaps explain why we put so much value on these trinkets.
How to Become an Engineering Psychologist
Engineering psychologists mainly specialize in developing safer and user-friendly products. Engineering psychology emerged during the World War II in 1940’s, as many traditional engineers began considering user factors when designing new products and programs. A career in engineering psychology would be ideal match for you if you enjoy designing and improving products to meet end-user’s needs.
How To Become A Speech-Language Pathologist
This infographic reveals the requirements to become a speech therapist in the US. Found within are the steps necessary for high school students to obtain a career in the speech therapy field. The student will be able to quickly understand the educational and career requirements. There is also a good overview of the job outlook for speech pathologists located in the United States.
Best Time to Buy a Car
When is the best time to buy a car? The infographic from FindtheBestCarPrice.com highlights what cars to buy in different seasons, the best time of the year, month, and day to buy a car.
Mobile Dependence: A Growing Trend in Business Travel
According to stats from PC Housing, smartphones and tablets are slowly placing themselves in between water and food as top necessities for business travelers. It makes sense. Being on the road is simply made easier and more manageable by these tools that allow us to stay connected but are these mobile devices taking up too much of our time?
Does Design Matter?
Many business and technology pundits say that design is becoming an increasingly important factor in the success of companies these days, but does that sentiment trickle down to the people actually running small businesses and deciding how much emphasis to place on design work?. 99designs surveyed 1,500 small businesses and start-ups to better understand the changing role of design in the business world.
Infographics Defined
It seems that infographics are everywhere you look these days. Many of the major tech sites feature them daily. Friends Tweet them and post them on their Facebook walls. However, its still surprising how many people don’t know what they are, how they are made or why they are so important for marketing. Here is an “infographic about infographics.”
Partners


Browse Archives By Category
Animated Infographics
Business Infographics
Career & Jobs Infographics
Education Infographics
Entertainment Industry Infographics
Environmental Infographics
Finance & Money Infographics
Food & Drink Infographics
Health Infographics
Historical Infographics
Home & Garden Infographics
Internet Infographics
Law and Legal Infographics
Lifestyle Infographics
Marketing Infographics
Offbeat Infographics
Parenting Infographics
Pets & Animals Infographics
Political Infographics
Shopping Infographics
Sports and Athletic Infographics
Technology Infographics
Transportation Infographics
Travel Infographics
Video Infographics