


Search 12,100+ Infographics!
Best Time to Buy a Car
When is the best time to buy a car? The infographic from FindtheBestCarPrice.com highlights what cars to buy in different seasons, the best time of the year, month, and day to buy a car.
Mobile Dependence: A Growing Trend in Business Travel
According to stats from PC Housing, smartphones and tablets are slowly placing themselves in between water and food as top necessities for business travelers. It makes sense. Being on the road is simply made easier and more manageable by these tools that allow us to stay connected but are these mobile devices taking up too much of our time?
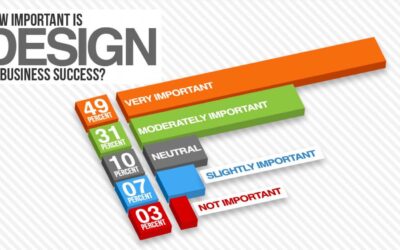
Does Design Matter?
Many business and technology pundits say that design is becoming an increasingly important factor in the success of companies these days, but does that sentiment trickle down to the people actually running small businesses and deciding how much emphasis to place on design work?. 99designs surveyed 1,500 small businesses and start-ups to better understand the changing role of design in the business world.
Infographics Defined
It seems that infographics are everywhere you look these days. Many of the major tech sites feature them daily. Friends Tweet them and post them on their Facebook walls. However, its still surprising how many people don’t know what they are, how they are made or why they are so important for marketing. Here is an “infographic about infographics.”
Pinterestingly Enough…
Pinterest debuted in 2010, and already has 10.4 million users. Most of those users have come recently as the site is experiencing a whopping 400% month-over-month growth! Pinterest represents a huge growth opportunity for businesses. Here is an infographic to help businesses better understand the phenomenon that is Pinterest.
Beginners Guide To Prepping For Doomsday
From zombies to financial fallout, doomsday can come in many forms. With the recent surge in popularity of doomsday prepping TV shows, and websites, it is important to be ready when the time comes. This infographic provides some basic guidelines to go by when the time comes to bug out. From fire arms to food storage, don’t be the one who isn’t ready!

Going Green & Going Paperless
With today’s business technologies, it’s no wonder why many businesses are electing to go green. In this infographic, learn how going green and paperless effects business and the environment.
Road Tripping with Fido?
Although driving without securing a small child in a car seat is illegal in all 50 states, only New Jersey bans pets from riding unrestrained in cars. What’s worse: animal restraints—specifically those for dogs—are not widely used, even though pet travel has increased 300 percent since 2005. Do you know how to safely travel with your family pet?
The Ultimate Money Test
The Ultimate Money Test is a unique test for knowledge, behavior and attitudes towards work, the economy, spending and saving money. Starting back in February, www.CreditCardCompare.com.au began surveying over 1,000 Australians. The results are now in, and they reveal that Australia is a nation of money savers and deal seekers.
Which Destination Is Right For You? Caribbean or Mexico
In this infographic, learn about several tropical resort destinations. With resorts throughout the Caribbean & Mexico, there exists accommodations to fit the needs of any traveler.
Best Time to Buy a Car
When is the best time to buy a car? The infographic from FindtheBestCarPrice.com highlights what cars to buy in different seasons, the best time of the year, month, and day to buy a car.
Mobile Dependence: A Growing Trend in Business Travel
According to stats from PC Housing, smartphones and tablets are slowly placing themselves in between water and food as top necessities for business travelers. It makes sense. Being on the road is simply made easier and more manageable by these tools that allow us to stay connected but are these mobile devices taking up too much of our time?
Does Design Matter?
Many business and technology pundits say that design is becoming an increasingly important factor in the success of companies these days, but does that sentiment trickle down to the people actually running small businesses and deciding how much emphasis to place on design work?. 99designs surveyed 1,500 small businesses and start-ups to better understand the changing role of design in the business world.
Infographics Defined
It seems that infographics are everywhere you look these days. Many of the major tech sites feature them daily. Friends Tweet them and post them on their Facebook walls. However, its still surprising how many people don’t know what they are, how they are made or why they are so important for marketing. Here is an “infographic about infographics.”
Pinterestingly Enough…
Pinterest debuted in 2010, and already has 10.4 million users. Most of those users have come recently as the site is experiencing a whopping 400% month-over-month growth! Pinterest represents a huge growth opportunity for businesses. Here is an infographic to help businesses better understand the phenomenon that is Pinterest.
Beginners Guide To Prepping For Doomsday
From zombies to financial fallout, doomsday can come in many forms. With the recent surge in popularity of doomsday prepping TV shows, and websites, it is important to be ready when the time comes. This infographic provides some basic guidelines to go by when the time comes to bug out. From fire arms to food storage, don’t be the one who isn’t ready!
Going Green & Going Paperless
With today’s business technologies, it’s no wonder why many businesses are electing to go green. In this infographic, learn how going green and paperless effects business and the environment.
Road Tripping with Fido?
Although driving without securing a small child in a car seat is illegal in all 50 states, only New Jersey bans pets from riding unrestrained in cars. What’s worse: animal restraints—specifically those for dogs—are not widely used, even though pet travel has increased 300 percent since 2005. Do you know how to safely travel with your family pet?
The Ultimate Money Test
The Ultimate Money Test is a unique test for knowledge, behavior and attitudes towards work, the economy, spending and saving money. Starting back in February, www.CreditCardCompare.com.au began surveying over 1,000 Australians. The results are now in, and they reveal that Australia is a nation of money savers and deal seekers.
Which Destination Is Right For You? Caribbean or Mexico
In this infographic, learn about several tropical resort destinations. With resorts throughout the Caribbean & Mexico, there exists accommodations to fit the needs of any traveler.
Partners


Browse Archives By Category
Animated Infographics
Business Infographics
Career & Jobs Infographics
Education Infographics
Entertainment Industry Infographics
Environmental Infographics
Finance & Money Infographics
Food & Drink Infographics
Health Infographics
Historical Infographics
Home & Garden Infographics
Internet Infographics
Law and Legal Infographics
Lifestyle Infographics
Marketing Infographics
Offbeat Infographics
Parenting Infographics
Pets & Animals Infographics
Political Infographics
Shopping Infographics
Sports and Athletic Infographics
Technology Infographics
Transportation Infographics
Travel Infographics
Video Infographics