


Search 12,100+ Infographics!
Body Hacks For A Longer Life
There’s a flood of mixed messages put out on a daily basis regarding one’s health. However, the key to staying healthy is fairly simple: live as natural a life as possible. This includes eating a natural diet. In fact, before eating, ask yourself: could I or my neighbors have made this? These and other interesting body hacks for a longer life in this infographic.

Home Safes – Everything You Need to Know
Choosing the right safe for your home can be a difficult task. Should you install a wall safe or will a floor safe suffice? Should it be fireproof and for how long? This helpful infographic from Safe Options aims to resolve all those questions regarding home safes.
How Pinterest Drives Ecommerce Sales
Pinterest is now the 3rd most popular social network site in the world! Shopify analyzed data from +25K online stores and shows their findings (including conversion rate, average cart size..etc..) in this infographic to demonstrate how Pinterest is driving ecommerce sales.
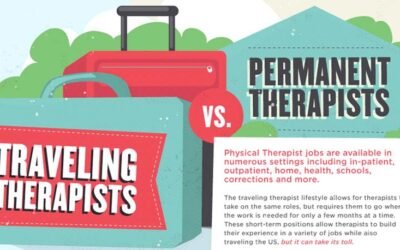
Travel Therapy vs Permanent Therapy Job
This infographic takes a look at the lifestyle of a traveling therapist, including physical therapists, occupational therapists, and speech-language pathologist and compares the salary, benefits, and job experience to that of a therapist taking a permanent position.
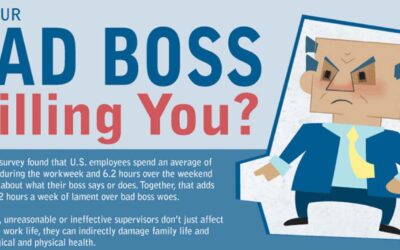
Is Your Bad Boss Killing You?
A recent survey found that U.S. employees spend an average of 13 hours during the workweek and 6.2 hours over the weekend worrying about their boss says or does. Together that adds up to 19.2 hour a week of lament over bad boss woes.

8 Tips to Teaching Your Child to Read
The earlier your child can learn to read the more likely he or she is to be successful in school. You can get your child reading early by following these eight tips to becoming a confident reader in the following infographic.
New American Transit: Shift From Car-Driven Culture
In celebration of Bike Month (all May) and the current Bike To Work Week, Fibers created this infographic illustrating the recent shift among young Americans, who are abandoning the car-driven culture and embracing the modern alternative transportation revolution.
The Evolution of Test Sets in Telecom History
This infographic traces the vast growth in telephony history throughout the past 170 years, beginning with linemans’ service of the telegraph through data transmission to the high speed data system we have today. It includes the history of the test set, or butt set, and how Fluke Networks’ TS54 TDR test set sets a new industry standard for the tool.
The Truth About Pasta
With over 1,572,571,546 kg of pasta eaten in Italy alone, this popular food comes in over six hundred different shapes and has a unique and colorful history. This infographic shares some fun facts and interesting information about this famous Italian food.
UK Burglary Hotspots
How safe is your neighborhood? Do you know? A new infographic has detailed the burglary hotspots across the UK, which seem to mainly be in London and Yorkshire! The infographic also looks at the behavior of criminals in the UK. For example, did you know that 44% of burglaries happen during the day?
Body Hacks For A Longer Life
There’s a flood of mixed messages put out on a daily basis regarding one’s health. However, the key to staying healthy is fairly simple: live as natural a life as possible. This includes eating a natural diet. In fact, before eating, ask yourself: could I or my neighbors have made this? These and other interesting body hacks for a longer life in this infographic.
Home Safes – Everything You Need to Know
Choosing the right safe for your home can be a difficult task. Should you install a wall safe or will a floor safe suffice? Should it be fireproof and for how long? This helpful infographic from Safe Options aims to resolve all those questions regarding home safes.
How Pinterest Drives Ecommerce Sales
Pinterest is now the 3rd most popular social network site in the world! Shopify analyzed data from +25K online stores and shows their findings (including conversion rate, average cart size..etc..) in this infographic to demonstrate how Pinterest is driving ecommerce sales.
Travel Therapy vs Permanent Therapy Job
This infographic takes a look at the lifestyle of a traveling therapist, including physical therapists, occupational therapists, and speech-language pathologist and compares the salary, benefits, and job experience to that of a therapist taking a permanent position.
Is Your Bad Boss Killing You?
A recent survey found that U.S. employees spend an average of 13 hours during the workweek and 6.2 hours over the weekend worrying about their boss says or does. Together that adds up to 19.2 hour a week of lament over bad boss woes.
8 Tips to Teaching Your Child to Read
The earlier your child can learn to read the more likely he or she is to be successful in school. You can get your child reading early by following these eight tips to becoming a confident reader in the following infographic.
New American Transit: Shift From Car-Driven Culture
In celebration of Bike Month (all May) and the current Bike To Work Week, Fibers created this infographic illustrating the recent shift among young Americans, who are abandoning the car-driven culture and embracing the modern alternative transportation revolution.
The Evolution of Test Sets in Telecom History
This infographic traces the vast growth in telephony history throughout the past 170 years, beginning with linemans’ service of the telegraph through data transmission to the high speed data system we have today. It includes the history of the test set, or butt set, and how Fluke Networks’ TS54 TDR test set sets a new industry standard for the tool.
The Truth About Pasta
With over 1,572,571,546 kg of pasta eaten in Italy alone, this popular food comes in over six hundred different shapes and has a unique and colorful history. This infographic shares some fun facts and interesting information about this famous Italian food.
UK Burglary Hotspots
How safe is your neighborhood? Do you know? A new infographic has detailed the burglary hotspots across the UK, which seem to mainly be in London and Yorkshire! The infographic also looks at the behavior of criminals in the UK. For example, did you know that 44% of burglaries happen during the day?
Partners


Browse Archives By Category
Animated Infographics
Business Infographics
Career & Jobs Infographics
Education Infographics
Entertainment Industry Infographics
Environmental Infographics
Finance & Money Infographics
Food & Drink Infographics
Health Infographics
Historical Infographics
Home & Garden Infographics
Internet Infographics
Law and Legal Infographics
Lifestyle Infographics
Marketing Infographics
Offbeat Infographics
Parenting Infographics
Pets & Animals Infographics
Political Infographics
Shopping Infographics
Sports and Athletic Infographics
Technology Infographics
Transportation Infographics
Travel Infographics
Video Infographics