


Search 12,100+ Infographics!
A Brief History of Cougars
Cougar, Mrs. Robinson, empowered woman – whatever you call them, middle-aged women are on the prowl, pulling in young men by the claw-full. They’ve banded together in conversations and organizations to hunt in packs and have become a massive social movement.
15 Ridiculous Laws Around The World
What would it be like to live in a world without laws? Pretty chaotic huh? So we need laws but some law are just ridiculous. This infographic, published by Prism Casino, brings you confirmed, real laws from around the world that are so silly you’ve probably never thought possible.
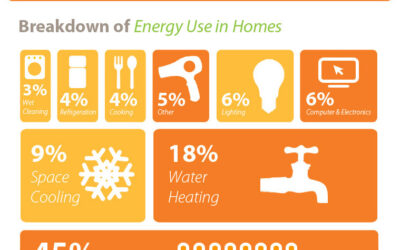
Energy Smarts: Breakdown of Energy Use in Homes
This infographic by Ambit Energy illustrates typical home energy use, as well as some simple ways to conserve. It may help you reduce your carbon footprint, increase your energy smarts and saved money in the process.
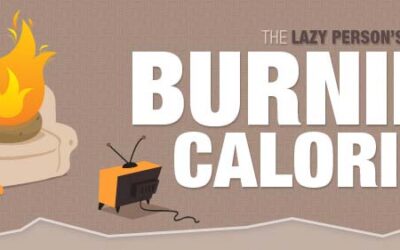
Lazy Person’s Guide To Burning Calories
As you might have guessed, there isn’t a way to sit on your couch all day and end up looking like a bodybuilder. There are however some everyday things you can do that are good for your health. These are things that you would probably do anyhow, so you might as well feel good about how many calories you’re burning by doing them.
How the (English) Channel Tunnel Was Built
The Channel Tunnel is one of the biggest engineering projects ever undertaken in the UK and had been named as one of the seven wonders of the modern world. This infographic describes how the impressive structure was built.
Get in the Loop – Raising Awareness for Lupus
May is seen as time to come together and help raise national awareness for all the forms of lupus. It is a time to show support for the estimated 1.5 million people in the United States who are affected by this chronic autoimmune disease. With the following infographic, which contains data and statistics on this disease, Achieve Clinical Research hopes to help raise awareness for lupus patients and their families.
Low Back Pain By the Numbers
Most Americans (61 percent) experience low back pain, but physical therapists can help regain mobility, activity and health by relieving the source and not just the symptoms of pain. Check out the infographic below, published by MoveForwardPT.com, for more statistical facts on low back pain.
20 Sobering DUI Statistics
This infographic has 20 very sobering DUI statistics that hopefully will make you think twice before driving under the influence. Remember, in some states if you are pulled over for a DUI and blow less than .08% BAC, you could still be arrested and convicted of a DUI if the officer believes that your ability to drive safely has been impaired by alcohol. For the safety of others and yourself, the smart choice is always not to drink and drive.
It’s All About the Images
Images make everything online better. And that’s a good thing considering how several big shifts in the social media world are now placing a bigger emphasis on using high-quality photos and/or images within content. Just how much does adding images to your content matter?
Anatomy of a DUI
So what is the real cost of a DUI? What’s involved in the DUI process once you’ve been arrested? This helpful infographic offers a nice visual look into the anatomy of a DUI. So if you’re drinking don’t drive, if you’re driving don’t drink.
A Brief History of Cougars
Cougar, Mrs. Robinson, empowered woman – whatever you call them, middle-aged women are on the prowl, pulling in young men by the claw-full. They’ve banded together in conversations and organizations to hunt in packs and have become a massive social movement.
15 Ridiculous Laws Around The World
What would it be like to live in a world without laws? Pretty chaotic huh? So we need laws but some law are just ridiculous. This infographic, published by Prism Casino, brings you confirmed, real laws from around the world that are so silly you’ve probably never thought possible.
Energy Smarts: Breakdown of Energy Use in Homes
This infographic by Ambit Energy illustrates typical home energy use, as well as some simple ways to conserve. It may help you reduce your carbon footprint, increase your energy smarts and saved money in the process.
Lazy Person’s Guide To Burning Calories
As you might have guessed, there isn’t a way to sit on your couch all day and end up looking like a bodybuilder. There are however some everyday things you can do that are good for your health. These are things that you would probably do anyhow, so you might as well feel good about how many calories you’re burning by doing them.
How the (English) Channel Tunnel Was Built
The Channel Tunnel is one of the biggest engineering projects ever undertaken in the UK and had been named as one of the seven wonders of the modern world. This infographic describes how the impressive structure was built.
Get in the Loop – Raising Awareness for Lupus
May is seen as time to come together and help raise national awareness for all the forms of lupus. It is a time to show support for the estimated 1.5 million people in the United States who are affected by this chronic autoimmune disease. With the following infographic, which contains data and statistics on this disease, Achieve Clinical Research hopes to help raise awareness for lupus patients and their families.
Low Back Pain By the Numbers
Most Americans (61 percent) experience low back pain, but physical therapists can help regain mobility, activity and health by relieving the source and not just the symptoms of pain. Check out the infographic below, published by MoveForwardPT.com, for more statistical facts on low back pain.
20 Sobering DUI Statistics
This infographic has 20 very sobering DUI statistics that hopefully will make you think twice before driving under the influence. Remember, in some states if you are pulled over for a DUI and blow less than .08% BAC, you could still be arrested and convicted of a DUI if the officer believes that your ability to drive safely has been impaired by alcohol. For the safety of others and yourself, the smart choice is always not to drink and drive.
It’s All About the Images
Images make everything online better. And that’s a good thing considering how several big shifts in the social media world are now placing a bigger emphasis on using high-quality photos and/or images within content. Just how much does adding images to your content matter?
Anatomy of a DUI
So what is the real cost of a DUI? What’s involved in the DUI process once you’ve been arrested? This helpful infographic offers a nice visual look into the anatomy of a DUI. So if you’re drinking don’t drive, if you’re driving don’t drink.
Partners


Browse Archives By Category
Animated Infographics
Business Infographics
Career & Jobs Infographics
Education Infographics
Entertainment Industry Infographics
Environmental Infographics
Finance & Money Infographics
Food & Drink Infographics
Health Infographics
Historical Infographics
Home & Garden Infographics
Internet Infographics
Law and Legal Infographics
Lifestyle Infographics
Marketing Infographics
Offbeat Infographics
Parenting Infographics
Pets & Animals Infographics
Political Infographics
Shopping Infographics
Sports and Athletic Infographics
Technology Infographics
Transportation Infographics
Travel Infographics
Video Infographics