


Search 12,100+ Infographics!
Where Our Oil Comes From
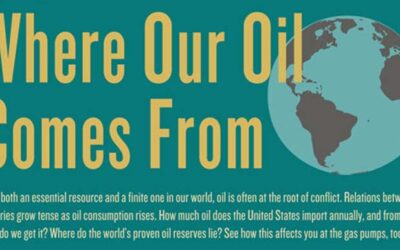
As both an essential resource as well as a finite one in our world, oil is often at the root of many conflicts. This infographic, published by Fuel Freedom, shows you where the United States gets its oil and why gasoline is at the high cost that it is currently.
LinkedIn Bootcamp: Basic Training For The Personal Marketer
LinkedIn is the proverbial dark horse of social media: we all know it’s there, but few of us use it to its full potential. This is a major mistake, especially when it comes to marketing your business. This LinkedIn Basic training infographic provides the tools necessary to best utilize the site for all your business and personal marketing needs.
Becoming the CEO of Your Home
In business, a manager must track budgets and costs, develop annual processes to get work done more efficiently, and manage risk for unexpected situations. It’s about time to apply these same strategies to home ownership. After all, it’s one of the biggest investments a person will make.
Small Business, Big Impact
Small businesses do more than provide services and products, they strengthen and shape our communities, our economy, philanthropic efforts, and innovate. The following infographic features some of the impact small businesses have on the American economy.
Cigar Wrapper Classifications
The actual “wrapper” of a cigar is the outermost portion of the cigar and is typically made from the larger, lower leaves of the tobacco plant. Wrapping around the cigar filler, the wrapper is what actually binds the cigar together and helps to determine the overall flavor. This infographic identifies different types of cigar wrappers and how they affect the cigar smoking experience.
Your Favorite Sitcom is Changing Into a Social Phenomenon
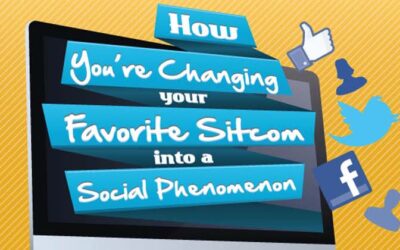
The sitcoms and dramas that television viewers love have become companions to social media with Facebook and Twitter chatter becoming a normal part of the viewing experience. And social-savvy networks are making the most of this new television-viewing trend.
Not Yo Mama’s Mama
Today’s moms are social media savvy and as such, are typically armed with gadgets. They’re packing technology, not just lunches. And while these moms have a new-found cool, they are still the moms we’ve loved all along. In this infographic, we explore the ways that moms are increasingly connected through social media and digital devices.
Brain Hack the Seven Deadly Sins
You’ve probably heard of some popular brain hacks that are supposed to make your life easier and more efficient. One’s like only needing two hours of sleep, or ones that are supposed to keep you energized all day. This new infographic from Become Career takes it to a new level by focusing on the issues we really need to hack: the seven deadly sins.
How to Spot an Instagram Junkie
Now 40 million users strong, Instagram has taken advantage of the photoblog trend and transformed into something of an overnight global success. With the start-up earning press for expanding it’s product to Android users and being snatched by Facebook’s powerful grasp, the tech world is wondering what kind of users are downloading the app and catapulting the brand to the top.
Life Insurance Facts & Figures
The following infographic, published by WholeTerm Life Insurance Quotes.org, shows some interesting facts from death causes to types of life insurance. Interesting enough, it has been said that over 95 million US adults don’t have life insurance. The goal of this data visualization is to help you realize just how important coverage is and provide you with everything you need to know about life insurance coverage.
Where Our Oil Comes From
As both an essential resource as well as a finite one in our world, oil is often at the root of many conflicts. This infographic, published by Fuel Freedom, shows you where the United States gets its oil and why gasoline is at the high cost that it is currently.
LinkedIn Bootcamp: Basic Training For The Personal Marketer
LinkedIn is the proverbial dark horse of social media: we all know it’s there, but few of us use it to its full potential. This is a major mistake, especially when it comes to marketing your business. This LinkedIn Basic training infographic provides the tools necessary to best utilize the site for all your business and personal marketing needs.
Becoming the CEO of Your Home
In business, a manager must track budgets and costs, develop annual processes to get work done more efficiently, and manage risk for unexpected situations. It’s about time to apply these same strategies to home ownership. After all, it’s one of the biggest investments a person will make.
Small Business, Big Impact
Small businesses do more than provide services and products, they strengthen and shape our communities, our economy, philanthropic efforts, and innovate. The following infographic features some of the impact small businesses have on the American economy.
Cigar Wrapper Classifications
The actual “wrapper” of a cigar is the outermost portion of the cigar and is typically made from the larger, lower leaves of the tobacco plant. Wrapping around the cigar filler, the wrapper is what actually binds the cigar together and helps to determine the overall flavor. This infographic identifies different types of cigar wrappers and how they affect the cigar smoking experience.
Your Favorite Sitcom is Changing Into a Social Phenomenon
The sitcoms and dramas that television viewers love have become companions to social media with Facebook and Twitter chatter becoming a normal part of the viewing experience. And social-savvy networks are making the most of this new television-viewing trend.
Not Yo Mama’s Mama
Today’s moms are social media savvy and as such, are typically armed with gadgets. They’re packing technology, not just lunches. And while these moms have a new-found cool, they are still the moms we’ve loved all along. In this infographic, we explore the ways that moms are increasingly connected through social media and digital devices.
Brain Hack the Seven Deadly Sins
You’ve probably heard of some popular brain hacks that are supposed to make your life easier and more efficient. One’s like only needing two hours of sleep, or ones that are supposed to keep you energized all day. This new infographic from Become Career takes it to a new level by focusing on the issues we really need to hack: the seven deadly sins.
How to Spot an Instagram Junkie
Now 40 million users strong, Instagram has taken advantage of the photoblog trend and transformed into something of an overnight global success. With the start-up earning press for expanding it’s product to Android users and being snatched by Facebook’s powerful grasp, the tech world is wondering what kind of users are downloading the app and catapulting the brand to the top.
Life Insurance Facts & Figures
The following infographic, published by WholeTerm Life Insurance Quotes.org, shows some interesting facts from death causes to types of life insurance. Interesting enough, it has been said that over 95 million US adults don’t have life insurance. The goal of this data visualization is to help you realize just how important coverage is and provide you with everything you need to know about life insurance coverage.
Partners


Browse Archives By Category
Animated Infographics
Business Infographics
Career & Jobs Infographics
Education Infographics
Entertainment Industry Infographics
Environmental Infographics
Finance & Money Infographics
Food & Drink Infographics
Health Infographics
Historical Infographics
Home & Garden Infographics
Internet Infographics
Law and Legal Infographics
Lifestyle Infographics
Marketing Infographics
Offbeat Infographics
Parenting Infographics
Pets & Animals Infographics
Political Infographics
Shopping Infographics
Sports and Athletic Infographics
Technology Infographics
Transportation Infographics
Travel Infographics
Video Infographics