


Search 12,100+ Infographics!
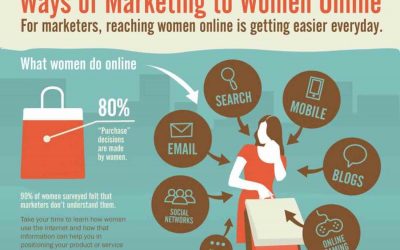
Ways of Marketing to Women Online
In marketing, it is well worth the time to learn how women use the internet and how that information can help you in positioning your product or service and in return help you to increase your conversions. This infographic explores some ways of effectively marketing to women online.
The Many Faces of the Internet User
The web is a menagerie of personalities, personas, and psychos, and you are likely to encounter several types of characters in your online travels. Take this guide with you as you journey deep into the dark heart of the Internet.
Interest in Pinterest
This infographic includes curated Pinterest research, demographics and stats and includes 20 facts every marketer needs to know about Pinterest.
What Women Really Want in Men
What does a woman want in a man? Well, according to the Theory of Evolution, she instinctively plans for a future as a mother by favoring a man who will make a good provider … older, established, of superior status. Today, in the post-feminist age of online dating, what makes a women happy? The following infographic created by Parship.de will explore this question.
Bumper to Bumper: Traffic Accidents in England & Wales
The number of cars on the road has increased steadily over the last few decades, so you’d expect the number of road accidents and casualties to have increased along with it. But think again. Confused.com outlines some surprising changes in the number of accidents and vehicle-related offenses in England and Wales over time.
NASCAR 101: The Beginner’s Guide to NASCAR
NASCAR – you either love it or hate it. It is certainly one of the most popular motorsport in the United States. And while you may understand how it works and all the lingo, there may be many who do not. This infographic will teach you the basics.
The Great Disruption: Future of Personal Tech
Whether we’re happy about it or not, our technology changes at a breakneck pace with all technologies eventually being overcome by new innovations. In the business world this kind of tech is known as “disruptive technology.” In this infographic, look at many of the crucial disruptions that have brought us to today’s tech.
A Tale of Two Meals: What’s Really Making Your Fat?
Imagine that it’s time for breakfast. You have two choices: A plate of bacon and eggs or a bagel and low-fat cream cheese. Both are tempting decisions, but which one will make you fatter?This infographic published by Massive Health tells the story.
The Boob Files: Things You May Not Know About Large Breasts
For whatever reason, large breasts often captivate the public. Many a time, they fill smaller-busted women with envy and are celebrated by men of all ages. This infographic shares the facts about large breasts: why they captivate us, how they can benefit us, and what you can do to have larger breasts.

The American Construction Industry
Did you know China is currently the world’s largest construction site? How about the fact that the average annual pay for a construction worker in 2010 was $44,000? Who are the top 10 largest contractors in the United States as of right now? This and other data on the construction industry in an infographic published by Rock & Dirt.
Ways of Marketing to Women Online
In marketing, it is well worth the time to learn how women use the internet and how that information can help you in positioning your product or service and in return help you to increase your conversions. This infographic explores some ways of effectively marketing to women online.
The Many Faces of the Internet User
The web is a menagerie of personalities, personas, and psychos, and you are likely to encounter several types of characters in your online travels. Take this guide with you as you journey deep into the dark heart of the Internet.
Interest in Pinterest
This infographic includes curated Pinterest research, demographics and stats and includes 20 facts every marketer needs to know about Pinterest.
What Women Really Want in Men
What does a woman want in a man? Well, according to the Theory of Evolution, she instinctively plans for a future as a mother by favoring a man who will make a good provider … older, established, of superior status. Today, in the post-feminist age of online dating, what makes a women happy? The following infographic created by Parship.de will explore this question.
Bumper to Bumper: Traffic Accidents in England & Wales
The number of cars on the road has increased steadily over the last few decades, so you’d expect the number of road accidents and casualties to have increased along with it. But think again. Confused.com outlines some surprising changes in the number of accidents and vehicle-related offenses in England and Wales over time.
NASCAR 101: The Beginner’s Guide to NASCAR
NASCAR – you either love it or hate it. It is certainly one of the most popular motorsport in the United States. And while you may understand how it works and all the lingo, there may be many who do not. This infographic will teach you the basics.
The Great Disruption: Future of Personal Tech
Whether we’re happy about it or not, our technology changes at a breakneck pace with all technologies eventually being overcome by new innovations. In the business world this kind of tech is known as “disruptive technology.” In this infographic, look at many of the crucial disruptions that have brought us to today’s tech.
A Tale of Two Meals: What’s Really Making Your Fat?
Imagine that it’s time for breakfast. You have two choices: A plate of bacon and eggs or a bagel and low-fat cream cheese. Both are tempting decisions, but which one will make you fatter?This infographic published by Massive Health tells the story.
The Boob Files: Things You May Not Know About Large Breasts
For whatever reason, large breasts often captivate the public. Many a time, they fill smaller-busted women with envy and are celebrated by men of all ages. This infographic shares the facts about large breasts: why they captivate us, how they can benefit us, and what you can do to have larger breasts.
The American Construction Industry
Did you know China is currently the world’s largest construction site? How about the fact that the average annual pay for a construction worker in 2010 was $44,000? Who are the top 10 largest contractors in the United States as of right now? This and other data on the construction industry in an infographic published by Rock & Dirt.
Partners


Browse Archives By Category
Animated Infographics
Business Infographics
Career & Jobs Infographics
Education Infographics
Entertainment Industry Infographics
Environmental Infographics
Finance & Money Infographics
Food & Drink Infographics
Health Infographics
Historical Infographics
Home & Garden Infographics
Internet Infographics
Law and Legal Infographics
Lifestyle Infographics
Marketing Infographics
Offbeat Infographics
Parenting Infographics
Pets & Animals Infographics
Political Infographics
Shopping Infographics
Sports and Athletic Infographics
Technology Infographics
Transportation Infographics
Travel Infographics
Video Infographics