


Search 12,100+ Infographics!
James Bond Ultimate Vehicles Guide
This infographic entitled “James Bond Ultimate Vehicles Guide,” is a celebration of both the 50th anniversary of the James Bond franchise and the showstopping vehicles that have appeared alongside 007 over the decades. Some of these vehicles were driven by super-villains, some by Bond himself and others, well, you’ll see.

The Power of In-Person
This infographic represents the results from a global survey conducted by The Economist Intelligence Unit, sponsored by Cisco, that assessed 862 business leaders’ sentiments about the value of in-person meetings and their impact on more than 30 business processes.
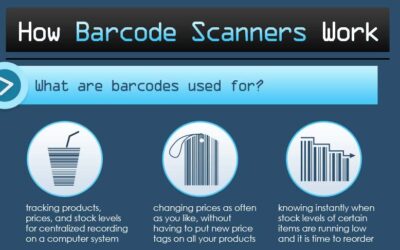
How Barcode Scanners Work
Barcodes – they’re everywhere and on just about everything. But how do these black and white striped graphics work and how they are properly read with a barcode scanner? Wasp Barcode has outlined a few barcoding basics, including how a barcode scanner works in their latest Infographic.
Geography of Sex
How often do you have sex? The answer to this question depends partly on where the person lives. As it turns out, certain cities tend to be a lot more sexually active than others and surprisingly enough, they aren’t the cities you would expect them to be (i.e. Las Vegas, Miami, and New York). The following infographic, published by Medical Insurance.org, provides the details.
Just How Big Is Apple?
This infographic takes a look at how big Apple really is. With 40% of Apple’s revenue coming from the iPhone alone, it has boosted the company to become the most valuable company in the world.
Sharing & Communication Though The Ages
In our current fast moving world of social media, the following infographic, developed by moo.com, takes a look back over all of human history to see how sharing and communication has evolved through cave paintings, carrier pigeons, newspapers and eventually to social media as we use it today.
Cyber Security
This infographic explains the real life issues with securing a company’s technology and intellectual property. Have a look to find out who you should be looking out for and how to best protect yourself.

From One Earth Day to the Next
Things are always in motion on Earth. Life is never static as we are constantly inhaling and exhaling, producing and consuming, enjoying and reflecting, and birthing and dying. This infographic reveals some interesting occurrences in a day on the Earth and how what happens impacts every single one of its inhabitants.

The Death of the DVD
Netflix, the king of the DVD rental business, lost 2.76 million DVD subscribers in the fourth quarter of 2011 as more and more of their customers shifted to online streaming-only packages. Even with this, Netflix still has a solid foothold in the DVD movie marketplace. But in 2012, movies viewed online are expected to outnumber movies viewed on DVD as well as other physical formats for the first time in history.
Landing Page Optimization
Landing page optimization is an internet marketing strategy in which different layouts of a webpage are compared and tested for performance. In this infographic, landing page optimization is first defined followed by illustration of the concept of comparing different Calls-to-Action using a fork in the road with 3 similar, yet slightly different billboards.
James Bond Ultimate Vehicles Guide
This infographic entitled “James Bond Ultimate Vehicles Guide,” is a celebration of both the 50th anniversary of the James Bond franchise and the showstopping vehicles that have appeared alongside 007 over the decades. Some of these vehicles were driven by super-villains, some by Bond himself and others, well, you’ll see.
The Power of In-Person
This infographic represents the results from a global survey conducted by The Economist Intelligence Unit, sponsored by Cisco, that assessed 862 business leaders’ sentiments about the value of in-person meetings and their impact on more than 30 business processes.
How Barcode Scanners Work
Barcodes – they’re everywhere and on just about everything. But how do these black and white striped graphics work and how they are properly read with a barcode scanner? Wasp Barcode has outlined a few barcoding basics, including how a barcode scanner works in their latest Infographic.
Geography of Sex
How often do you have sex? The answer to this question depends partly on where the person lives. As it turns out, certain cities tend to be a lot more sexually active than others and surprisingly enough, they aren’t the cities you would expect them to be (i.e. Las Vegas, Miami, and New York). The following infographic, published by Medical Insurance.org, provides the details.
Just How Big Is Apple?
This infographic takes a look at how big Apple really is. With 40% of Apple’s revenue coming from the iPhone alone, it has boosted the company to become the most valuable company in the world.
Sharing & Communication Though The Ages
In our current fast moving world of social media, the following infographic, developed by moo.com, takes a look back over all of human history to see how sharing and communication has evolved through cave paintings, carrier pigeons, newspapers and eventually to social media as we use it today.
Cyber Security
This infographic explains the real life issues with securing a company’s technology and intellectual property. Have a look to find out who you should be looking out for and how to best protect yourself.
From One Earth Day to the Next
Things are always in motion on Earth. Life is never static as we are constantly inhaling and exhaling, producing and consuming, enjoying and reflecting, and birthing and dying. This infographic reveals some interesting occurrences in a day on the Earth and how what happens impacts every single one of its inhabitants.
The Death of the DVD
Netflix, the king of the DVD rental business, lost 2.76 million DVD subscribers in the fourth quarter of 2011 as more and more of their customers shifted to online streaming-only packages. Even with this, Netflix still has a solid foothold in the DVD movie marketplace. But in 2012, movies viewed online are expected to outnumber movies viewed on DVD as well as other physical formats for the first time in history.
Landing Page Optimization
Landing page optimization is an internet marketing strategy in which different layouts of a webpage are compared and tested for performance. In this infographic, landing page optimization is first defined followed by illustration of the concept of comparing different Calls-to-Action using a fork in the road with 3 similar, yet slightly different billboards.
Partners


Browse Archives By Category
Animated Infographics
Business Infographics
Career & Jobs Infographics
Education Infographics
Entertainment Industry Infographics
Environmental Infographics
Finance & Money Infographics
Food & Drink Infographics
Health Infographics
Historical Infographics
Home & Garden Infographics
Internet Infographics
Law and Legal Infographics
Lifestyle Infographics
Marketing Infographics
Offbeat Infographics
Parenting Infographics
Pets & Animals Infographics
Political Infographics
Shopping Infographics
Sports and Athletic Infographics
Technology Infographics
Transportation Infographics
Travel Infographics
Video Infographics