


Search 12,100+ Infographics!
9 Tips and Tricks for Organizing a Workshop
Having your own workshop is incredible. You have this fantastic place to keep all of your things and work on all of your projects. That is until it becomes cluttered and you have no idea where anything is. Here is an infographic that provides 9 tips and tricks for organizing a workshop.

How Society Creates Entrepreneurs
So many people want to become entrepreneurs these days. But how are entrepreneurs created? Check out the following infographic for a deep dive from EdSmart on their contract with society and how to become an entrepreneur.

How to Pick the Best Email Marketing Platform
Email is far from dead – it’s all about how you use it. Not all email marketing platforms are created equal. With all of the options out there, it’s helpful to have a list to see which is the best email marketing platform. Check out this infographic for more information on how to pick the best email marketing platform.
Remote Work is Here to Stay
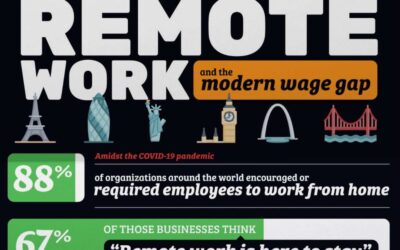
The pandemic has changed the way we work and remote work and work flexibility is here to stay. Take a look at where people are moving to and how this will impact the wage gap. Check out this visual deep dive courtesy of TrackTime24.

Why MBA After B.Tech, Engineering, BBA or BCA is a Good Option
There are many alternatives while selecting a postgraduate program for students in almost every stream. Check out the following infographic from IIM Udaipur on why an MBA after B.Tech, Engineering, BBA or BCA is a good option.
Personal Protection Equipment
There are many reasons to consider your safety in the workplace. Whether you work in a high-risk industry like construction or in a bustling warehouse, it is important for you to remember to wear the right personal protective equipment. This gear helps you stay safe and sound no matter what demands are placed on your shoulders in a given day.

How to Pick the Best WordPress Hosting
Not all website hosting providers are created equal. Many websites run WordPress and speed is such an important factor in the pandemic world we live in. Check out this visual deep dive on how to pick the best WordPress hosting provider.

The United States Ranked by the Oldest City in Each State
Although the United States didn’t achieve independence from Great Britain until 1776, many cities in the country were settled hundreds of years earlier. European explorers began arriving on the shores of the U.S. in the early 16th century to establish settlements, some of which still exist today. In the following infographic, TitleMax looks at the oldest cities in each U.S. state.

Social Media Superstars
Stars of the stage, screen and pitch take the top spots on Facebook and Instagram. However, Instagram has set the scene for the rise of the Influencer. Social Media exists in a universe of its own, but the cross-over between the real world and its online counterpart is alive and kicking. In this infographic, take a look at the world’s most active social media channels to chart what’s happening where.

10 Facts to Save on Heating Costs in 2021
If you feel like your heating costs are rising every year, you are not alone. As most of us have been working from home for most of 2020, it’s easy to see bills creep up and costs start to skyrocket. You may think that there isn’t much you can do to cut costs and save yourself from a panic attack every time you receive your bill, but that couldn’t be further from the truth.
9 Tips and Tricks for Organizing a Workshop
Having your own workshop is incredible. You have this fantastic place to keep all of your things and work on all of your projects. That is until it becomes cluttered and you have no idea where anything is. Here is an infographic that provides 9 tips and tricks for organizing a workshop.
How Society Creates Entrepreneurs
So many people want to become entrepreneurs these days. But how are entrepreneurs created? Check out the following infographic for a deep dive from EdSmart on their contract with society and how to become an entrepreneur.
How to Pick the Best Email Marketing Platform
Email is far from dead – it’s all about how you use it. Not all email marketing platforms are created equal. With all of the options out there, it’s helpful to have a list to see which is the best email marketing platform. Check out this infographic for more information on how to pick the best email marketing platform.
Remote Work is Here to Stay
The pandemic has changed the way we work and remote work and work flexibility is here to stay. Take a look at where people are moving to and how this will impact the wage gap. Check out this visual deep dive courtesy of TrackTime24.
Why MBA After B.Tech, Engineering, BBA or BCA is a Good Option
There are many alternatives while selecting a postgraduate program for students in almost every stream. Check out the following infographic from IIM Udaipur on why an MBA after B.Tech, Engineering, BBA or BCA is a good option.
Personal Protection Equipment
There are many reasons to consider your safety in the workplace. Whether you work in a high-risk industry like construction or in a bustling warehouse, it is important for you to remember to wear the right personal protective equipment. This gear helps you stay safe and sound no matter what demands are placed on your shoulders in a given day.
How to Pick the Best WordPress Hosting
Not all website hosting providers are created equal. Many websites run WordPress and speed is such an important factor in the pandemic world we live in. Check out this visual deep dive on how to pick the best WordPress hosting provider.
The United States Ranked by the Oldest City in Each State
Although the United States didn’t achieve independence from Great Britain until 1776, many cities in the country were settled hundreds of years earlier. European explorers began arriving on the shores of the U.S. in the early 16th century to establish settlements, some of which still exist today. In the following infographic, TitleMax looks at the oldest cities in each U.S. state.
Social Media Superstars
Stars of the stage, screen and pitch take the top spots on Facebook and Instagram. However, Instagram has set the scene for the rise of the Influencer. Social Media exists in a universe of its own, but the cross-over between the real world and its online counterpart is alive and kicking. In this infographic, take a look at the world’s most active social media channels to chart what’s happening where.
10 Facts to Save on Heating Costs in 2021
If you feel like your heating costs are rising every year, you are not alone. As most of us have been working from home for most of 2020, it’s easy to see bills creep up and costs start to skyrocket. You may think that there isn’t much you can do to cut costs and save yourself from a panic attack every time you receive your bill, but that couldn’t be further from the truth.
Partners


Browse Archives By Category
Animated Infographics
Business Infographics
Career & Jobs Infographics
Education Infographics
Entertainment Industry Infographics
Environmental Infographics
Finance & Money Infographics
Food & Drink Infographics
Health Infographics
Historical Infographics
Home & Garden Infographics
Internet Infographics
Law and Legal Infographics
Lifestyle Infographics
Marketing Infographics
Offbeat Infographics
Parenting Infographics
Pets & Animals Infographics
Political Infographics
Shopping Infographics
Sports and Athletic Infographics
Technology Infographics
Transportation Infographics
Travel Infographics
Video Infographics