


Search 12,100+ Infographics!
Retirement Planning Unraveled
Retirement planning is more intimidating than any other personal finance topic. Luckily, funding a secure and enjoyable retirement need not be mysterious. This infographic shows you exactly what to do.
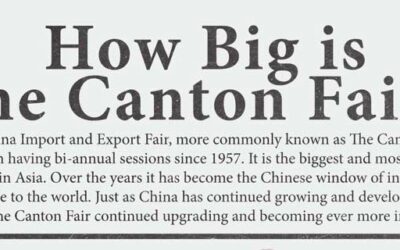
How Big is the Canton Fair
The Canton Fair has been held bi-annually in the southern Chinese city of Guangzhou since 1957, and in this time it has grown to phenomenal heights, following the trajectory of the Chinese economy itself. This infographic, published by China Performance Group, shows just how big the fair has grown in the time since its inception giving you an idea of how to prepare.
A Global Look at Personal Income Taxes
With tax season upon us, have you ever wondered how much people pay in taxes in other countries? Turbotax has put together an interactive infographic that compares personal income tax rates around the world. You may be surprised by which countries have the lowest and highest income tax rates.
Beer Saved the World
Did beer really save the world? No doubt the benefits of beer go way back. In fact it was Benjamin Franklin, one of America’s forefathers, who said, “Beer is living proof that God loves us and wants us to be happy.” This infographic takes a look at the colorful history of one of our favorite beverages.
The Path to Owning Your First Home
Let’s face facts: the home buying process can be a bit overwhelming for a first time buyer. How much can I afford? Do I need to have a down payment and how much? These and other important questions are answered in the following infographic.
Drug Use on U.S. College Campuses
While the average college experience isn’t quite what you might see in Animal House (actually I heard it can be worse), it is often referred to as a four year party. What drugs are college students taking, and what are some of the consequences?

How to Survive a Zombie Apocalypse
Are you prepared for the zombie apocalypse? Zombies can be deadly but if you follow these tips and tricks provide in infographic from by Goal Zero, you should survive like a pro. All you need are some portable solar panels, Michael Jackson’s “Thriller,” and a Costco in Canada. Then you’ll be set to ward off those brain-eating fiends.

10 College Degrees Hiring Managers Don’t Want To See
In today’s economy, employers pay more attention to the degree you get than ever before. Best Degree Programs has created an infographic with helpful information and facts to help you in achieving your job goal.
A Look at Small Business Hiring Intentions
Intuit, maker of QuickBooks accounting software, presents an infographic look at the hiring intentions of small businesses in the UK. What do they intend to do when it comes to hiring employees? What is preventing them from taking on staff? What could persuade them to take on their first employee? Find out with this infographic, based on a survey of over 500 small businesses in the UK.

The Best Recycling Programs in the US & Around The World
With the growing concern of expendable resources, interest in recycling equipment is at an all-time high. This infographic tells a great story of recycling, beginning with countries with the best recycling rates. Explore the top 10 greenest US & Canadian cities and other eye opening facts.
Retirement Planning Unraveled
Retirement planning is more intimidating than any other personal finance topic. Luckily, funding a secure and enjoyable retirement need not be mysterious. This infographic shows you exactly what to do.
How Big is the Canton Fair
The Canton Fair has been held bi-annually in the southern Chinese city of Guangzhou since 1957, and in this time it has grown to phenomenal heights, following the trajectory of the Chinese economy itself. This infographic, published by China Performance Group, shows just how big the fair has grown in the time since its inception giving you an idea of how to prepare.
A Global Look at Personal Income Taxes
With tax season upon us, have you ever wondered how much people pay in taxes in other countries? Turbotax has put together an interactive infographic that compares personal income tax rates around the world. You may be surprised by which countries have the lowest and highest income tax rates.
Beer Saved the World
Did beer really save the world? No doubt the benefits of beer go way back. In fact it was Benjamin Franklin, one of America’s forefathers, who said, “Beer is living proof that God loves us and wants us to be happy.” This infographic takes a look at the colorful history of one of our favorite beverages.
The Path to Owning Your First Home
Let’s face facts: the home buying process can be a bit overwhelming for a first time buyer. How much can I afford? Do I need to have a down payment and how much? These and other important questions are answered in the following infographic.
Drug Use on U.S. College Campuses
While the average college experience isn’t quite what you might see in Animal House (actually I heard it can be worse), it is often referred to as a four year party. What drugs are college students taking, and what are some of the consequences?
How to Survive a Zombie Apocalypse
Are you prepared for the zombie apocalypse? Zombies can be deadly but if you follow these tips and tricks provide in infographic from by Goal Zero, you should survive like a pro. All you need are some portable solar panels, Michael Jackson’s “Thriller,” and a Costco in Canada. Then you’ll be set to ward off those brain-eating fiends.
10 College Degrees Hiring Managers Don’t Want To See
In today’s economy, employers pay more attention to the degree you get than ever before. Best Degree Programs has created an infographic with helpful information and facts to help you in achieving your job goal.
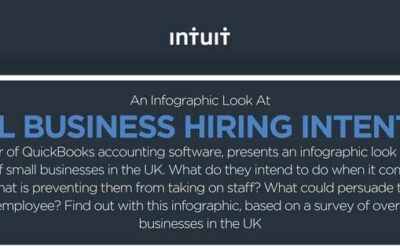
A Look at Small Business Hiring Intentions
Intuit, maker of QuickBooks accounting software, presents an infographic look at the hiring intentions of small businesses in the UK. What do they intend to do when it comes to hiring employees? What is preventing them from taking on staff? What could persuade them to take on their first employee? Find out with this infographic, based on a survey of over 500 small businesses in the UK.
The Best Recycling Programs in the US & Around The World
With the growing concern of expendable resources, interest in recycling equipment is at an all-time high. This infographic tells a great story of recycling, beginning with countries with the best recycling rates. Explore the top 10 greenest US & Canadian cities and other eye opening facts.
Partners


Browse Archives By Category
Animated Infographics
Business Infographics
Career & Jobs Infographics
Education Infographics
Entertainment Industry Infographics
Environmental Infographics
Finance & Money Infographics
Food & Drink Infographics
Health Infographics
Historical Infographics
Home & Garden Infographics
Internet Infographics
Law and Legal Infographics
Lifestyle Infographics
Marketing Infographics
Offbeat Infographics
Parenting Infographics
Pets & Animals Infographics
Political Infographics
Shopping Infographics
Sports and Athletic Infographics
Technology Infographics
Transportation Infographics
Travel Infographics
Video Infographics