

Search 12,000+ Infographics!
The Anatomy of A New Fitness Routine
Getting in shape can be easier said than done. Many start a new fitness routine with the best of intentions, only to have their efforts dwindle when obstacles and excuses get in the way. This infographic provides valuable exercise tips and advice to help you establish a successful and long-lasting exercise routine.
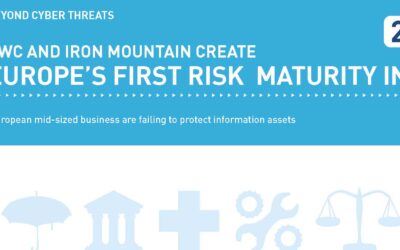
Europe’s First Risk Maturity Index
This infographic summarizes new research into risk management issues in European businesses. The research is a stark reminder to SMEs about the real risks they face in terms of data protection. The infographic highlights the key facts of the study and shows that failure to perform proper risk assessment and make changes could mean the difference between a business’s ultimate success or failure.
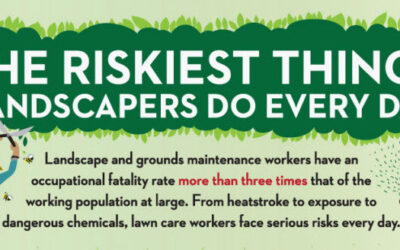
The Riskiest Things Landscapers Do Every Day
This infographic highlights everyday dangers that landscapers face such as allergic reactions, cuts and amputations, machinery, pesticides, chemicals, sun, and high temperatures. Many of these risks are also present for those who do their own lawn care – which shows the importance of hiring qualified and insured landscaping and lawn care professionals to do these jobs for you.
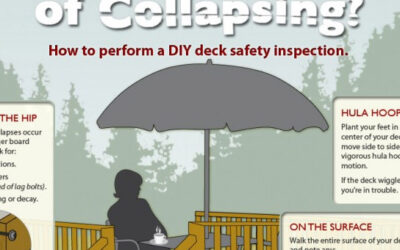
DIY Wood Deck Inspection
Is your wood deck in danger of collapsing? Find out now by inspecting your deck properly. This helpful infographic from Ricks Custom Fencing and Decking highlights the steps of a DIY wood decking inspection.
Every Move You Make: Location-Based Social Media
As social media platforms continue to take advantage of GPS tracking, it’s easy to know every step of every person in our social network. Sure, we know if our friend saw a movie or went to the gym, but how much do we want to disclose about our physical locations? This infographic shows exactly what we’re revealing when we broadcast our whereabouts.

Common Rules for Capital Letter Usage
Rules for capitalization vary by language, country and even word usage. This infographic contains a few tips that are useful for determining when all capital letters should be used or when the first character needs to be written in capital letter form.
You Deducted What? Devious Deductions & Eccentric Tax Evaders
Tax day is upon us! What will you deduct and what will you actually get away with? Check out some of the strangest things taxpayers have deducted legitimately as well as those that have failed , and which celebrities got nabbed for not paying taxes at all in this infographic.
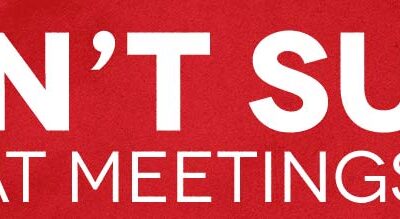
Don’t Suck At Meetings
The corporate world loves meetings, but are they really effective when you look at the big picture? SalesCrunch has created a new infographic that shows exactly how much money you are spending on meetings, and how you can see more results by making them shorter and more efficient.
Bad Driving Habits: The Secret Lives of Drivers
Every day, men and women take to their cars to ferry them across town and country in the United Kingdom. But many of them are distracted in multiple ways. Confused.com surveyed 2,000 people to find out what potentially dangerous driving habits they may have picked up.
Why Is Pinterest So Addictive?
Flowtown has published the following infographic that examines “Pinterest addiction” which seems to be spreading like a zombie apocalypse virus. Proof? Pinterest users spend an average 98 minutes on site per month, third only to Tumblr (2.5 hours) and Facebook (7 hours). And is there an antidote? Why would you want one?
The Anatomy of A New Fitness Routine
Getting in shape can be easier said than done. Many start a new fitness routine with the best of intentions, only to have their efforts dwindle when obstacles and excuses get in the way. This infographic provides valuable exercise tips and advice to help you establish a successful and long-lasting exercise routine.
Europe’s First Risk Maturity Index
This infographic summarizes new research into risk management issues in European businesses. The research is a stark reminder to SMEs about the real risks they face in terms of data protection. The infographic highlights the key facts of the study and shows that failure to perform proper risk assessment and make changes could mean the difference between a business’s ultimate success or failure.
The Riskiest Things Landscapers Do Every Day
This infographic highlights everyday dangers that landscapers face such as allergic reactions, cuts and amputations, machinery, pesticides, chemicals, sun, and high temperatures. Many of these risks are also present for those who do their own lawn care – which shows the importance of hiring qualified and insured landscaping and lawn care professionals to do these jobs for you.
DIY Wood Deck Inspection
Is your wood deck in danger of collapsing? Find out now by inspecting your deck properly. This helpful infographic from Ricks Custom Fencing and Decking highlights the steps of a DIY wood decking inspection.
Every Move You Make: Location-Based Social Media
As social media platforms continue to take advantage of GPS tracking, it’s easy to know every step of every person in our social network. Sure, we know if our friend saw a movie or went to the gym, but how much do we want to disclose about our physical locations? This infographic shows exactly what we’re revealing when we broadcast our whereabouts.
Common Rules for Capital Letter Usage
Rules for capitalization vary by language, country and even word usage. This infographic contains a few tips that are useful for determining when all capital letters should be used or when the first character needs to be written in capital letter form.
You Deducted What? Devious Deductions & Eccentric Tax Evaders
Tax day is upon us! What will you deduct and what will you actually get away with? Check out some of the strangest things taxpayers have deducted legitimately as well as those that have failed , and which celebrities got nabbed for not paying taxes at all in this infographic.
Don’t Suck At Meetings
The corporate world loves meetings, but are they really effective when you look at the big picture? SalesCrunch has created a new infographic that shows exactly how much money you are spending on meetings, and how you can see more results by making them shorter and more efficient.
Bad Driving Habits: The Secret Lives of Drivers
Every day, men and women take to their cars to ferry them across town and country in the United Kingdom. But many of them are distracted in multiple ways. Confused.com surveyed 2,000 people to find out what potentially dangerous driving habits they may have picked up.
Why Is Pinterest So Addictive?
Flowtown has published the following infographic that examines “Pinterest addiction” which seems to be spreading like a zombie apocalypse virus. Proof? Pinterest users spend an average 98 minutes on site per month, third only to Tumblr (2.5 hours) and Facebook (7 hours). And is there an antidote? Why would you want one?
Partners


Browse Archives By Category
Animated Infographics
Business Infographics
Career & Jobs Infographics
Education Infographics
Entertainment Industry Infographics
Environmental Infographics
Finance & Money Infographics
Food & Drink Infographics
Health Infographics
Historical Infographics
Home & Garden Infographics
Internet Infographics
Law and Legal Infographics
Lifestyle Infographics
Marketing Infographics
Offbeat Infographics
Parenting Infographics
Pets & Animals Infographics
Political Infographics
Shopping Infographics
Sports and Athletic Infographics
Technology Infographics
Transportation Infographics
Travel Infographics
Video Infographics