Search 12,000+ Infographics!
The Global Appeal of Angry Birds
Angry Birds – one of the most popular mobile games of all times. And if you are still sitting on the fence and want to know more info behind this addictive mobile game, this infographic published by AYTM Market Research may provide you the answers you need.
Driving With Distractions
This infographic from BOLT explains the potential distractions drivers are faced with every time they get behind the wheel. For instance, from the radio, to passengers, cellphones, or the fast food people eat, these and other distractions can lead to disaster in a split second.
Taxes on Americas Favorite Beverage: Soda
The concept of a soda tax (which is an additional tax) is very controversial in America and it’s an issue that has yet to be resolved say John Block, MD, of Harvard Medical School, commenting on whether states should increase taxes on soda in order to reduce obesity. But is this the real reason behind this tax? The following infographic published by Turbo Tax explores the issue.
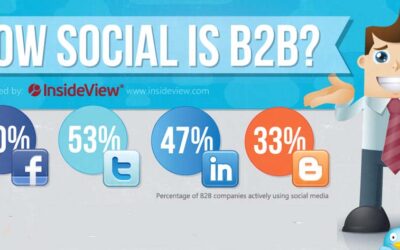
How Social Is B2B?
Social media was once considered a trend, then a time-waster. Today it is a valuable tool businesses can use to connect with customers, and we are seeing real numbers when it comes to social media marketing. This infographic shows just what this industry is doing for B2B.
Cupcakes Continue To Dominate
A U.S. cupcake chain names “Sprinkles” just released cupcake ATMs. There’s a TV show, “Cupcake Wars,” on Food Network, dedicated to finding the best cupcakes in the world. Obviously we are crazy for cupcakes (I know I am), but are they here to stay, or are they just a foodie fad?
The Anatomy of A New Fitness Routine
Getting in shape can be easier said than done. Many start a new fitness routine with the best of intentions, only to have their efforts dwindle when obstacles and excuses get in the way. This infographic provides valuable exercise tips and advice to help you establish a successful and long-lasting exercise routine.
Europe’s First Risk Maturity Index
This infographic summarizes new research into risk management issues in European businesses. The research is a stark reminder to SMEs about the real risks they face in terms of data protection. The infographic highlights the key facts of the study and shows that failure to perform proper risk assessment and make changes could mean the difference between a business’s ultimate success or failure.
The Riskiest Things Landscapers Do Every Day
This infographic highlights everyday dangers that landscapers face such as allergic reactions, cuts and amputations, machinery, pesticides, chemicals, sun, and high temperatures. Many of these risks are also present for those who do their own lawn care – which shows the importance of hiring qualified and insured landscaping and lawn care professionals to do these jobs for you.
DIY Wood Deck Inspection
Is your wood deck in danger of collapsing? Find out now by inspecting your deck properly. This helpful infographic from Ricks Custom Fencing and Decking highlights the steps of a DIY wood decking inspection.
Every Move You Make: Location-Based Social Media
As social media platforms continue to take advantage of GPS tracking, it’s easy to know every step of every person in our social network. Sure, we know if our friend saw a movie or went to the gym, but how much do we want to disclose about our physical locations? This infographic shows exactly what we’re revealing when we broadcast our whereabouts.
Partners
Browse Archives By Category
Animated Infographics
Business Infographics
Career & Jobs Infographics
Education Infographics
Entertainment Industry Infographics
Environmental Infographics
Finance & Money Infographics
Food & Drink Infographics
Health Infographics
Historical Infographics
Home & Garden Infographics
Internet Infographics
Law and Legal Infographics
Lifestyle Infographics
Marketing Infographics
Offbeat Infographics
Parenting Infographics
Pets & Animals Infographics
Political Infographics
Shopping Infographics
Sports and Athletic Infographics
Technology Infographics
Transportation Infographics
Travel Infographics
Video Infographics


