


Search 12,100+ Infographics!

Think You Need 8 Glasses of Water a Day? Think Again!
We are told by doctors, nutritionists and the like that we should be drinking at least eight glasses of water a day. However, did you know that the “water footprint” of the average American is 32,911 glasses per day? This and other interesting statistics about water usage in this infographic by The Nature Conservancy.
The High Stakes World of Mobile Payments
Mobile payments are huge, and they’re only getting more popular as time goes on. This new infographic takes a look at the different companies jumping into the mobile payments game, as well as the current and projected growth of the mobile payment and credit card industries.
Everything You Need To Know About GPS Tracking
Sure most of us are familiar with GPS on our mobile devices for check-in purposes, mapping and the like. But what about the tracking of persons and equipment such as autos? This infographic illustrates the benefits of GPS Tracking, its’ history, and current statistics associated with vehicle & asset theft.

Biofuel Usage in the UK
Biofuel is becoming an increasingly popular option in the UK, with a recent government report revealing that 1,440 million litres of biofuel were supplied to the UK in 2011 alone. This infographic from Stavely Head contains further facts and statistics based on this government report, compiled together to create a bright and fun data visualization.
The Business of Sports
We all know sports are fun to play and fun to watch, and you’d have to be living under a rock to not be aware of the high figures sports stars earn each year, but what’s going on behind the scenes? This new infographic from Top Business Degrees explores the business side of the sports industry, and the tremendous effects it has on the American economy.
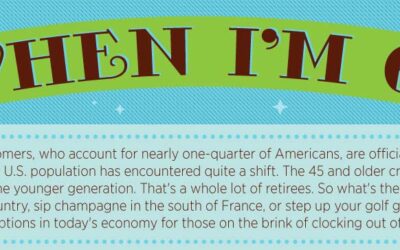
When I’m 64
Baby boomers are far from babies now, which means as they age, they’re setting their sights on retirement. It might not be the easiest for many, though, as one-in-three Americans reports they don’t have savings for retirement past Social Security. So, what’s the plan for this enormous population?
The Social Media Sharing Avalanche
The last several years has seen an explosion in social media and social networking. This increase in inter-connectivity between people has led to an incredible rise in the amount of information being shared, a trend that promises only to accelerate in coming years.
The Global Appeal of Angry Birds
Angry Birds – one of the most popular mobile games of all times. And if you are still sitting on the fence and want to know more info behind this addictive mobile game, this infographic published by AYTM Market Research may provide you the answers you need.
Driving With Distractions
This infographic from BOLT explains the potential distractions drivers are faced with every time they get behind the wheel. For instance, from the radio, to passengers, cellphones, or the fast food people eat, these and other distractions can lead to disaster in a split second.
Taxes on Americas Favorite Beverage: Soda
The concept of a soda tax (which is an additional tax) is very controversial in America and it’s an issue that has yet to be resolved say John Block, MD, of Harvard Medical School, commenting on whether states should increase taxes on soda in order to reduce obesity. But is this the real reason behind this tax? The following infographic published by Turbo Tax explores the issue.
Think You Need 8 Glasses of Water a Day? Think Again!
We are told by doctors, nutritionists and the like that we should be drinking at least eight glasses of water a day. However, did you know that the “water footprint” of the average American is 32,911 glasses per day? This and other interesting statistics about water usage in this infographic by The Nature Conservancy.
The High Stakes World of Mobile Payments
Mobile payments are huge, and they’re only getting more popular as time goes on. This new infographic takes a look at the different companies jumping into the mobile payments game, as well as the current and projected growth of the mobile payment and credit card industries.
Everything You Need To Know About GPS Tracking
Sure most of us are familiar with GPS on our mobile devices for check-in purposes, mapping and the like. But what about the tracking of persons and equipment such as autos? This infographic illustrates the benefits of GPS Tracking, its’ history, and current statistics associated with vehicle & asset theft.
Biofuel Usage in the UK
Biofuel is becoming an increasingly popular option in the UK, with a recent government report revealing that 1,440 million litres of biofuel were supplied to the UK in 2011 alone. This infographic from Stavely Head contains further facts and statistics based on this government report, compiled together to create a bright and fun data visualization.
The Business of Sports
We all know sports are fun to play and fun to watch, and you’d have to be living under a rock to not be aware of the high figures sports stars earn each year, but what’s going on behind the scenes? This new infographic from Top Business Degrees explores the business side of the sports industry, and the tremendous effects it has on the American economy.
When I’m 64
Baby boomers are far from babies now, which means as they age, they’re setting their sights on retirement. It might not be the easiest for many, though, as one-in-three Americans reports they don’t have savings for retirement past Social Security. So, what’s the plan for this enormous population?
The Social Media Sharing Avalanche
The last several years has seen an explosion in social media and social networking. This increase in inter-connectivity between people has led to an incredible rise in the amount of information being shared, a trend that promises only to accelerate in coming years.
The Global Appeal of Angry Birds
Angry Birds – one of the most popular mobile games of all times. And if you are still sitting on the fence and want to know more info behind this addictive mobile game, this infographic published by AYTM Market Research may provide you the answers you need.
Driving With Distractions
This infographic from BOLT explains the potential distractions drivers are faced with every time they get behind the wheel. For instance, from the radio, to passengers, cellphones, or the fast food people eat, these and other distractions can lead to disaster in a split second.
Taxes on Americas Favorite Beverage: Soda
The concept of a soda tax (which is an additional tax) is very controversial in America and it’s an issue that has yet to be resolved say John Block, MD, of Harvard Medical School, commenting on whether states should increase taxes on soda in order to reduce obesity. But is this the real reason behind this tax? The following infographic published by Turbo Tax explores the issue.
Partners


Browse Archives By Category
Animated Infographics
Business Infographics
Career & Jobs Infographics
Education Infographics
Entertainment Industry Infographics
Environmental Infographics
Finance & Money Infographics
Food & Drink Infographics
Health Infographics
Historical Infographics
Home & Garden Infographics
Internet Infographics
Law and Legal Infographics
Lifestyle Infographics
Marketing Infographics
Offbeat Infographics
Parenting Infographics
Pets & Animals Infographics
Political Infographics
Shopping Infographics
Sports and Athletic Infographics
Technology Infographics
Transportation Infographics
Travel Infographics
Video Infographics