


Search 12,100+ Infographics!
America’s Health Care Diagnosis
With the introduction of Obamacare, America’s health care system has become more complex. This infographic takes a look at some of the details surrounding the controversial change in health care policies, while poking fun at the public’s increasing disinterest in the topic.
Are Bananas As Bad for You as Cookies?
Researchers from the University of Sydney set out to determine which foods fill you up and keep you full. The result was the satiety index — a measure of how full you feel after eating something. So, which one should you grab if you’re trying to satisfy hunger – a banana or a cookie?
Industry Statistics QR Codes
QR Codes, otherwise known as “quick response codes” are part of a whole new way of connecting with consumers via their smart phones and mobile devices. The following infographic, published by Wasp Barcode, provides a brief history of how bar codes and QR codes came into existence as well as some statistics on how they are being used today.
Should Your Business Be on Pinterest?
America’s newest social media darling, Pinterest, can be an attractive proposition for small businesses who want to display their products. But how do you know if Pinterest is right for your business? Take the test below, published by Intuit and in infographic format, to find out.
Should You Rent or Buy?
To rent or to buy? That’s the big question for many families today. With the housing market in a dip, many people are hearing that it’s a good idea to purchase a house. However, it is a big decision and one that should not be taken lightly. ForRent.com helps weigh the pros and cons of renting versus buying.
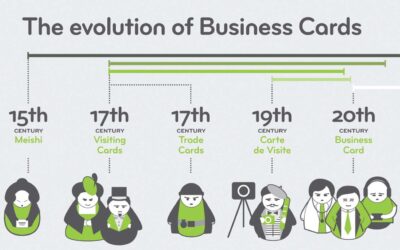
The Evolution of Business Cards
Business cards have been a staple of business status for many years, containing varying degrees of contact information, personal details and business service information. In 2007 the US business card industry had an estimated worth of $1.2 billion with approximately 10 billion business cards being produced each year!
15 Things You Should Know About Caffeine
First isolated in coffee back in 1820, caffeine is the tacit drug of choice for millions as it can be found in numerous beverages and medications. However, not a lot of people stop to appreciate what caffeine actually is and what it does.
Stay Safe on the Slopes
Spring is upon us but the ski season continues so long as there is ample snow. This infographic published by Hiscox offers tips on how to ensure your ski trip is fully insured, highlighting activities which some ski/travel insurances may not cover.
Streamlining Your Digital Life With the New iPad
The digital world is converging on a revolutionary all-in-one device, the powerful, brand new iPad. These are the iconic portable devices that are causing many older devices to become extinct because of Apple’s innovation. This infographic highlights some of those devices that are either now extinct or very soon will be.
Social vs. Search
While there are many differences between social media and search marketing, both are essential in marketing today. While each has its strengths, they take on exponentially more power when marketers use them together. To identify what works best for particular goals, MDG Advertising created this enlightening infographic that distinguishes the digital supremacy between social media and search marketing, as well as the collective strength of this dynamic duo.
America’s Health Care Diagnosis
With the introduction of Obamacare, America’s health care system has become more complex. This infographic takes a look at some of the details surrounding the controversial change in health care policies, while poking fun at the public’s increasing disinterest in the topic.
Are Bananas As Bad for You as Cookies?
Researchers from the University of Sydney set out to determine which foods fill you up and keep you full. The result was the satiety index — a measure of how full you feel after eating something. So, which one should you grab if you’re trying to satisfy hunger – a banana or a cookie?
Industry Statistics QR Codes
QR Codes, otherwise known as “quick response codes” are part of a whole new way of connecting with consumers via their smart phones and mobile devices. The following infographic, published by Wasp Barcode, provides a brief history of how bar codes and QR codes came into existence as well as some statistics on how they are being used today.
Should Your Business Be on Pinterest?
America’s newest social media darling, Pinterest, can be an attractive proposition for small businesses who want to display their products. But how do you know if Pinterest is right for your business? Take the test below, published by Intuit and in infographic format, to find out.
Should You Rent or Buy?
To rent or to buy? That’s the big question for many families today. With the housing market in a dip, many people are hearing that it’s a good idea to purchase a house. However, it is a big decision and one that should not be taken lightly. ForRent.com helps weigh the pros and cons of renting versus buying.
The Evolution of Business Cards
Business cards have been a staple of business status for many years, containing varying degrees of contact information, personal details and business service information. In 2007 the US business card industry had an estimated worth of $1.2 billion with approximately 10 billion business cards being produced each year!
15 Things You Should Know About Caffeine
First isolated in coffee back in 1820, caffeine is the tacit drug of choice for millions as it can be found in numerous beverages and medications. However, not a lot of people stop to appreciate what caffeine actually is and what it does.
Stay Safe on the Slopes
Spring is upon us but the ski season continues so long as there is ample snow. This infographic published by Hiscox offers tips on how to ensure your ski trip is fully insured, highlighting activities which some ski/travel insurances may not cover.
Streamlining Your Digital Life With the New iPad
The digital world is converging on a revolutionary all-in-one device, the powerful, brand new iPad. These are the iconic portable devices that are causing many older devices to become extinct because of Apple’s innovation. This infographic highlights some of those devices that are either now extinct or very soon will be.
Social vs. Search
While there are many differences between social media and search marketing, both are essential in marketing today. While each has its strengths, they take on exponentially more power when marketers use them together. To identify what works best for particular goals, MDG Advertising created this enlightening infographic that distinguishes the digital supremacy between social media and search marketing, as well as the collective strength of this dynamic duo.
Partners


Browse Archives By Category
Animated Infographics
Business Infographics
Career & Jobs Infographics
Education Infographics
Entertainment Industry Infographics
Environmental Infographics
Finance & Money Infographics
Food & Drink Infographics
Health Infographics
Historical Infographics
Home & Garden Infographics
Internet Infographics
Law and Legal Infographics
Lifestyle Infographics
Marketing Infographics
Offbeat Infographics
Parenting Infographics
Pets & Animals Infographics
Political Infographics
Shopping Infographics
Sports and Athletic Infographics
Technology Infographics
Transportation Infographics
Travel Infographics
Video Infographics