


Search 12,100+ Infographics!

Homeschool Domination: Why These Kids Will Take You Down
With America’s public school system in decline, more and more parents are turning to homeschooling as a solution to their children’s education. The surprising part? When it comes time to perform, homescholled children are blowing away everyone else out of the water.
How Social Ads Will Win the Election Ad Wars
Advertising in the social ecosystem offers presidential candidates bigger results than tweeting and Facebooking alone. Mainstream media is already asking: how big a role will social ads play in the 2012 presidential election? 140 Proof reviewed data from the 2004 and 2008 elections as well as recent reporting from AdAge, Adweek, and eMarketer in order to create this infographic about the 2012 landscape for political advertising.
Mad About March Madness
March Madness is about hardcore hoop playing by collegiate super-athletes, but the real madness of America’s favorite tournament is actually in the revenue it generates. Exclusive TV deals, colossal coach salaries and heavy betting have turned the most celebrated tradition in college sports into a numbers game. CouponCabin takes a look at that revenue and how Americans fit into the equation.
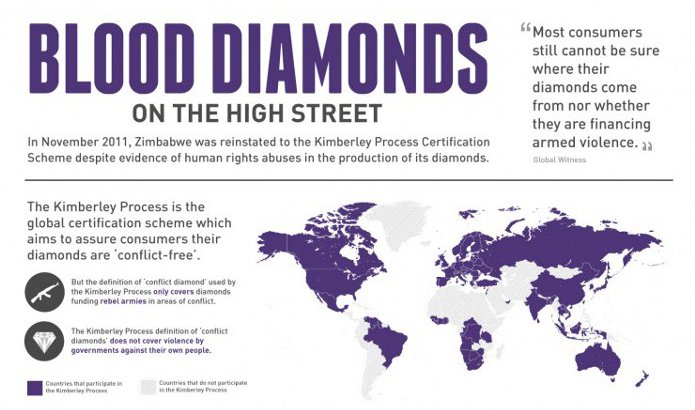
Blood Diamonds On The High Street
In 2003 the United Nations introduced the Kimberley Process Certification Scheme (KPCS) to certify that diamonds are conflict free. The KPCS defines conflict diamonds as those which are funding rebel armies in areas of conflict. One flaw in the process is that it does not recognize governments who are committing acts of violence in their own country.
How To Maximize Your Apartment Space
Living in a small space doesn’t necessarily mean you need to think small. There are many ways that you can make your apartment modern over messy and cozy rather than cramped. ForRent.com shows you how to turn a small apartment into an organized and stylish space.
Instant America: Slow Websites Send Visitors Scurrying
Today’s world of web browsing is facilitated by lighting-speed data connectivity as well as speedy computer processing all of which allows people to gain access to information in milliseconds, that is until a slow web site brings the process to a grinding halt. And because of our impatience, a slow-loading web site often has us using the back button to escape and move on somewhere else.
Electric Cars vs Gas Cars
The following infographic compares everything from emissions to gas consumption of electric-powered cars vs gas-powered cars. There are a lot of great facts and informative stats that may even help you decide on your next auto purchase.
Kids: How Things Have Changed from 1982 to 2012
You may currently be the parent of a teenager and wondering what the hell you’ve gotten yourself into. But do you have it worse than parents of the past? We all know that kids will be kids, but how much do they change over the course of a generation? This fun infographic compares kids as they are today to how they were 30 years ago.

The Anatomy of a Boss from Hell
Most people think that the psychopaths in our world are behind bars and locked up with the key thrown away. What people don’t realize is that many times, these psychos are the ones that sign our paychecks. If that is you, enjoy the following infographic published by Become Career entitled “The Anatomy of a Boss from Hell.”
How to Survive a Nuclear Holocaust
The events last year at the Fukushima Daiichi reactor complex in Japan brought into focus the very real danger of a nuclear holocaust. The following infographic by BestHealthDegrees.com presents some practical steps you can take to survive the danger posed by harmful nuclear radiation.
Homeschool Domination: Why These Kids Will Take You Down
With America’s public school system in decline, more and more parents are turning to homeschooling as a solution to their children’s education. The surprising part? When it comes time to perform, homescholled children are blowing away everyone else out of the water.
How Social Ads Will Win the Election Ad Wars
Advertising in the social ecosystem offers presidential candidates bigger results than tweeting and Facebooking alone. Mainstream media is already asking: how big a role will social ads play in the 2012 presidential election? 140 Proof reviewed data from the 2004 and 2008 elections as well as recent reporting from AdAge, Adweek, and eMarketer in order to create this infographic about the 2012 landscape for political advertising.
Mad About March Madness
March Madness is about hardcore hoop playing by collegiate super-athletes, but the real madness of America’s favorite tournament is actually in the revenue it generates. Exclusive TV deals, colossal coach salaries and heavy betting have turned the most celebrated tradition in college sports into a numbers game. CouponCabin takes a look at that revenue and how Americans fit into the equation.
Blood Diamonds On The High Street
In 2003 the United Nations introduced the Kimberley Process Certification Scheme (KPCS) to certify that diamonds are conflict free. The KPCS defines conflict diamonds as those which are funding rebel armies in areas of conflict. One flaw in the process is that it does not recognize governments who are committing acts of violence in their own country.
How To Maximize Your Apartment Space
Living in a small space doesn’t necessarily mean you need to think small. There are many ways that you can make your apartment modern over messy and cozy rather than cramped. ForRent.com shows you how to turn a small apartment into an organized and stylish space.
Instant America: Slow Websites Send Visitors Scurrying
Today’s world of web browsing is facilitated by lighting-speed data connectivity as well as speedy computer processing all of which allows people to gain access to information in milliseconds, that is until a slow web site brings the process to a grinding halt. And because of our impatience, a slow-loading web site often has us using the back button to escape and move on somewhere else.
Electric Cars vs Gas Cars
The following infographic compares everything from emissions to gas consumption of electric-powered cars vs gas-powered cars. There are a lot of great facts and informative stats that may even help you decide on your next auto purchase.
Kids: How Things Have Changed from 1982 to 2012
You may currently be the parent of a teenager and wondering what the hell you’ve gotten yourself into. But do you have it worse than parents of the past? We all know that kids will be kids, but how much do they change over the course of a generation? This fun infographic compares kids as they are today to how they were 30 years ago.
The Anatomy of a Boss from Hell
Most people think that the psychopaths in our world are behind bars and locked up with the key thrown away. What people don’t realize is that many times, these psychos are the ones that sign our paychecks. If that is you, enjoy the following infographic published by Become Career entitled “The Anatomy of a Boss from Hell.”
How to Survive a Nuclear Holocaust
The events last year at the Fukushima Daiichi reactor complex in Japan brought into focus the very real danger of a nuclear holocaust. The following infographic by BestHealthDegrees.com presents some practical steps you can take to survive the danger posed by harmful nuclear radiation.
Partners


Browse Archives By Category
Animated Infographics
Business Infographics
Career & Jobs Infographics
Education Infographics
Entertainment Industry Infographics
Environmental Infographics
Finance & Money Infographics
Food & Drink Infographics
Health Infographics
Historical Infographics
Home & Garden Infographics
Internet Infographics
Law and Legal Infographics
Lifestyle Infographics
Marketing Infographics
Offbeat Infographics
Parenting Infographics
Pets & Animals Infographics
Political Infographics
Shopping Infographics
Sports and Athletic Infographics
Technology Infographics
Transportation Infographics
Travel Infographics
Video Infographics