


Search 12,100+ Infographics!
The People Behind The Way We Live
Do you ever stop to think how many of the inventions we utilize on a daily basis and often take for granted came to be? The following infographic from BestCollegesOnline.org takes a look at how some of the most widely used inventions originally came about as well as how they evolved over time.
Are You Addicted to the Internet?
The risk of Internet addiction is up, and some studies have shown it could be as powerful an addiction as substance abuse. SodaHead asked its users if they thought they were addicted to the Internet and were surprised to see how many actually admitted to it – especially young people. The details are in the following infographic entitled “Are You Addicted to the Internet?”
The New Restaurant Critic is You!
The following infographic highlights the changes that have occurred in the history of food safety. Today’s consumers are encouraged to provide their feedback using social media and review sites to promote better food safety standards.
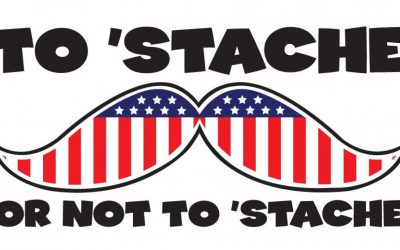
To ‘Stache or Not to ‘Stache: The Plight of the Mustached American
On President’s Day, H&R Block introduced the Million Mustache March in support of the the American Mustache Institute’s Stimulus to Allow Critical Hair Expenses (or STACHE Act), which would allow a $250 tax deduction for mustached Americans. Want to support the cause? read on to find out how.
Domain Names 101
There certainly is some strategy in buying a domain name. Not only can they paint a picture of your brand or business, they can be investments as well. The following infographic provides a basic education on how to go about domain name acquisition.
London – Three Times An Olympic City
In just a few months, London will be the very first city to host the modern Olympic Games for the third time.This infographic from Airport Parking Quote looks at some history from the previous two times the Olympics were hosted in London and makes some comparisons to what this current year holds.
Making Patient Experience a Priority
“Patient experience” may be the latest buzzword in the healthcare industry, but few organizations really understand what it is and how to improve it. The following infographic published by Beryl Health explains why patient experience should be more than just a buzzword and why “closing the loop” is more important than ever.
7 Reasons to Embrace Online Culture
2 billion people are online. 85% of customers expect businesses to be active in social media. Word of mouse = word of mouth. You can hate social media but if you are looking to gain business, you certainly can’t ignore it. The following infographic published provides 7 reasons to embrace online culture and some thought provoking questions to get you loving Facebook, Twitter, emarketing, blogs and more.
Rock of Ages: The Evolution of SxSW
Since 1987, SXSW has morphed into an interactive, film and music conference and festival that brought together 19,364 attendees in 2011. Rocksauce Studios has created the following infographic that dissects the interactive portion of SXSW, and proves why this conference is the new popular techie playground.
Very “Pinteresting” – Demographics on Pinterest Users
One thing marketers and brand managers cannot ignore is the fact that Pinterest has provoked a resurgence of web site referrals, which have been trending downward since the advent of other social sites like Facebook and Twitter. The details included in the following infographic will help you better understand this audience and ultimately, the undeniable impact of Pinterest as a referral platform.
The People Behind The Way We Live
Do you ever stop to think how many of the inventions we utilize on a daily basis and often take for granted came to be? The following infographic from BestCollegesOnline.org takes a look at how some of the most widely used inventions originally came about as well as how they evolved over time.
Are You Addicted to the Internet?
The risk of Internet addiction is up, and some studies have shown it could be as powerful an addiction as substance abuse. SodaHead asked its users if they thought they were addicted to the Internet and were surprised to see how many actually admitted to it – especially young people. The details are in the following infographic entitled “Are You Addicted to the Internet?”
The New Restaurant Critic is You!
The following infographic highlights the changes that have occurred in the history of food safety. Today’s consumers are encouraged to provide their feedback using social media and review sites to promote better food safety standards.
To ‘Stache or Not to ‘Stache: The Plight of the Mustached American
On President’s Day, H&R Block introduced the Million Mustache March in support of the the American Mustache Institute’s Stimulus to Allow Critical Hair Expenses (or STACHE Act), which would allow a $250 tax deduction for mustached Americans. Want to support the cause? read on to find out how.
Domain Names 101
There certainly is some strategy in buying a domain name. Not only can they paint a picture of your brand or business, they can be investments as well. The following infographic provides a basic education on how to go about domain name acquisition.
London – Three Times An Olympic City
In just a few months, London will be the very first city to host the modern Olympic Games for the third time.This infographic from Airport Parking Quote looks at some history from the previous two times the Olympics were hosted in London and makes some comparisons to what this current year holds.
Making Patient Experience a Priority
“Patient experience” may be the latest buzzword in the healthcare industry, but few organizations really understand what it is and how to improve it. The following infographic published by Beryl Health explains why patient experience should be more than just a buzzword and why “closing the loop” is more important than ever.
7 Reasons to Embrace Online Culture
2 billion people are online. 85% of customers expect businesses to be active in social media. Word of mouse = word of mouth. You can hate social media but if you are looking to gain business, you certainly can’t ignore it. The following infographic published provides 7 reasons to embrace online culture and some thought provoking questions to get you loving Facebook, Twitter, emarketing, blogs and more.
Rock of Ages: The Evolution of SxSW
Since 1987, SXSW has morphed into an interactive, film and music conference and festival that brought together 19,364 attendees in 2011. Rocksauce Studios has created the following infographic that dissects the interactive portion of SXSW, and proves why this conference is the new popular techie playground.
Very “Pinteresting” – Demographics on Pinterest Users
One thing marketers and brand managers cannot ignore is the fact that Pinterest has provoked a resurgence of web site referrals, which have been trending downward since the advent of other social sites like Facebook and Twitter. The details included in the following infographic will help you better understand this audience and ultimately, the undeniable impact of Pinterest as a referral platform.
Partners


Browse Archives By Category
Animated Infographics
Business Infographics
Career & Jobs Infographics
Education Infographics
Entertainment Industry Infographics
Environmental Infographics
Finance & Money Infographics
Food & Drink Infographics
Health Infographics
Historical Infographics
Home & Garden Infographics
Internet Infographics
Law and Legal Infographics
Lifestyle Infographics
Marketing Infographics
Offbeat Infographics
Parenting Infographics
Pets & Animals Infographics
Political Infographics
Shopping Infographics
Sports and Athletic Infographics
Technology Infographics
Transportation Infographics
Travel Infographics
Video Infographics