


Search 12,100+ Infographics!

The Smarter Way to File Your Taxes
The deadline to file taxes will be coming up sooner than you know, but choosing the right tax preparation service and keeping in mind commonly missed deductions will put you on the right path to filing your taxes smarter. This infographic provides all the information you need plus it also highlights making good decisions on how to invest your refund check to boost next year’s taxes.
America’s Billion Dollar Baby Scam
Marketers makes billions betting each year on the anxieties of American parents and their willingness to overspend on their babies. The official Big Baby line: when it comes to the $800 strollers and Mommy and Me Yoga, families concerned with the best in health and safety will spend to catch up.
The Founder’s Dictionary: Buzzwords Every Entrepreneur Should Know
Spend some time in Silicon Valley and your ears will no doubt experience an endless barrage of startup-related buzzwords. Words like “pivot,” “hyperlocal,” and “MVP” are all used in the business vernacular, but truth be told most people don’t know what they actually mean. With that in mind, Udemy.com picked the brains of some of “The Valley’s” finest founders and big players to provide you with the real definitions of these mysterious words.
How to Become a Backyard Zookeeper
Do you love zoo animals? Do you have questionable morals and ethics? Then running a backyard zoo could be for you! It’s actually pretty inexpensive and depending on where you live, you may not even need a permit. The following infographic from HowDoIBecomeA.net provides information if you decide to be a backyard zookeeper.
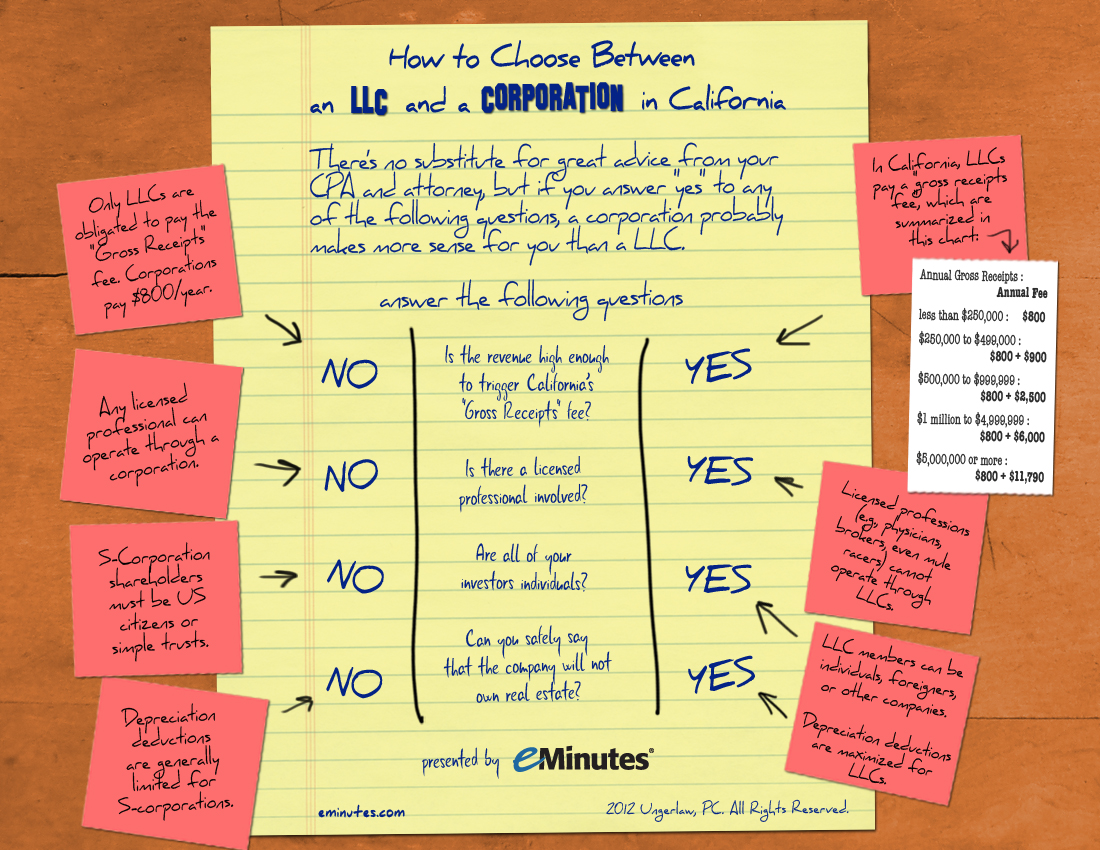
How to Choose Between an LLC and a Corporation in California
Far too often, entrepreneurs are unaware that LLCs and corporations are very different. Although virtually the same from a liability protection standpoint, they are extremely different from a tax standpoint. A lawyer and a CPA can help you evaluate the pros and cons of corporations and LLCs, but in the meantime, the following infographic from eMinutes provides some basic guidelines.
What’s Driving Consumer Confidence in 2012?
In early 2012, the Idea Group at Communispace had conversations with hundreds of members of the agency’s private online communities about what made them confident (or not-confident) about their ability to make purchases this year. They found that overwhelmingly, personal factors such as savings and cash on hand much more heavily impacted consumer confidence.
Everything You Need To Know About Mother’s Day
In a day and age of me, me , me, moms are still the most important person in most of our lives and Mother’s day is as important as ever. Even the Romans took time out of conquering the known world to celebrate their version of Mother’s day and the Americans have been celebrating it for 150 years. Learn something new about Mother’s Day with this infographic below.

How Your Tax Dollars Are Educating America
Out of all the revenue Uncle Sam pulls in each year, 4.8% of those precious tax dollars go toward education. But how, exactly, is that chunk of change used? The following infographic published by H&R Block breaks down the budgets and make sense of the dollars in the American education system.
15 Grammar Goofs That Make You Look Silly
Engaging online writing is informal, conversational, and fun, but certain goofy mistakes just make you look silly… and not in a good way.This infographic published at Copyblogger and designed by BlueGlass looks at 15 of the most egregious grammar goofs.
Top 10 Internet IPOs Over the Last 10 Years
Many like myself are anxiously waiting to see how Facebook’s IPO will go once it is public. But what about some of the other Internet-based companies and their IPOs? How well did they fare and more importantly, how are they doing today? This infographic takes a look at the top 10 Internet IPOs over the last 10 years.
The Smarter Way to File Your Taxes
The deadline to file taxes will be coming up sooner than you know, but choosing the right tax preparation service and keeping in mind commonly missed deductions will put you on the right path to filing your taxes smarter. This infographic provides all the information you need plus it also highlights making good decisions on how to invest your refund check to boost next year’s taxes.
America’s Billion Dollar Baby Scam
Marketers makes billions betting each year on the anxieties of American parents and their willingness to overspend on their babies. The official Big Baby line: when it comes to the $800 strollers and Mommy and Me Yoga, families concerned with the best in health and safety will spend to catch up.
The Founder’s Dictionary: Buzzwords Every Entrepreneur Should Know
Spend some time in Silicon Valley and your ears will no doubt experience an endless barrage of startup-related buzzwords. Words like “pivot,” “hyperlocal,” and “MVP” are all used in the business vernacular, but truth be told most people don’t know what they actually mean. With that in mind, Udemy.com picked the brains of some of “The Valley’s” finest founders and big players to provide you with the real definitions of these mysterious words.
How to Become a Backyard Zookeeper
Do you love zoo animals? Do you have questionable morals and ethics? Then running a backyard zoo could be for you! It’s actually pretty inexpensive and depending on where you live, you may not even need a permit. The following infographic from HowDoIBecomeA.net provides information if you decide to be a backyard zookeeper.
How to Choose Between an LLC and a Corporation in California
Far too often, entrepreneurs are unaware that LLCs and corporations are very different. Although virtually the same from a liability protection standpoint, they are extremely different from a tax standpoint. A lawyer and a CPA can help you evaluate the pros and cons of corporations and LLCs, but in the meantime, the following infographic from eMinutes provides some basic guidelines.
What’s Driving Consumer Confidence in 2012?
In early 2012, the Idea Group at Communispace had conversations with hundreds of members of the agency’s private online communities about what made them confident (or not-confident) about their ability to make purchases this year. They found that overwhelmingly, personal factors such as savings and cash on hand much more heavily impacted consumer confidence.
Everything You Need To Know About Mother’s Day
In a day and age of me, me , me, moms are still the most important person in most of our lives and Mother’s day is as important as ever. Even the Romans took time out of conquering the known world to celebrate their version of Mother’s day and the Americans have been celebrating it for 150 years. Learn something new about Mother’s Day with this infographic below.
How Your Tax Dollars Are Educating America
Out of all the revenue Uncle Sam pulls in each year, 4.8% of those precious tax dollars go toward education. But how, exactly, is that chunk of change used? The following infographic published by H&R Block breaks down the budgets and make sense of the dollars in the American education system.
15 Grammar Goofs That Make You Look Silly
Engaging online writing is informal, conversational, and fun, but certain goofy mistakes just make you look silly… and not in a good way.This infographic published at Copyblogger and designed by BlueGlass looks at 15 of the most egregious grammar goofs.
Top 10 Internet IPOs Over the Last 10 Years
Many like myself are anxiously waiting to see how Facebook’s IPO will go once it is public. But what about some of the other Internet-based companies and their IPOs? How well did they fare and more importantly, how are they doing today? This infographic takes a look at the top 10 Internet IPOs over the last 10 years.
Partners


Browse Archives By Category
Animated Infographics
Business Infographics
Career & Jobs Infographics
Education Infographics
Entertainment Industry Infographics
Environmental Infographics
Finance & Money Infographics
Food & Drink Infographics
Health Infographics
Historical Infographics
Home & Garden Infographics
Internet Infographics
Law and Legal Infographics
Lifestyle Infographics
Marketing Infographics
Offbeat Infographics
Parenting Infographics
Pets & Animals Infographics
Political Infographics
Shopping Infographics
Sports and Athletic Infographics
Technology Infographics
Transportation Infographics
Travel Infographics
Video Infographics