


Search 12,100+ Infographics!
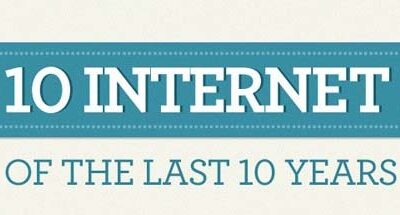
Top 10 Internet IPOs Over the Last 10 Years
Many like myself are anxiously waiting to see how Facebook’s IPO will go once it is public. But what about some of the other Internet-based companies and their IPOs? How well did they fare and more importantly, how are they doing today? This infographic takes a look at the top 10 Internet IPOs over the last 10 years.
Website Testing: Move Beyond the Landing Page
Smart marketers understand the value of testing. In a relatively short period of time, website testing has evolved from changing the color of a “submit” button on one web page, to building intricate, multi-page testing campaigns with the ultimate goal of delivering an engaging online experience to customers.
Legal Weed’s Top 10 Greatest Hits
The Internet has been having a lot of fun with weed over the last year, and WeedMaps hopes to contribute with their new infographic. The Top 10 Greatest “Hits” explores different strains and uses of medicinal marijuana.
Beware of These Internet Related Illnesses
Using the Internet daily has become almost unavoidable these days. However having the Internet at your fingertips at all times might not always be a positive thing. According to a recently published study in General Hospital Psychiatry, excessive use of the Internet can cause Internet Addiction Disorder, or IAD, which can lead to anxiety and depression.
I Need to Get a WHAT!?
Colorectal cancer is one of the most commonly diagnosed cancers in the United States. According to a study published in the New England Journal of Medicine, removing precancerous growths found during a colonoscopy can cut the risk of dying from colon cancer in half. Less than half of adults over the age of 50 have been screened, mainly because they are afraid of the test.
The Scenic Route to a Longer Life
There are certain widely accepted paths to good health and a longer life. But if quitting smoking, eating a balanced diet, and maintaining a healthy weight aren’t your thing, what’s an aspiring centenarian to do?The following infographic from Confused.com provides some additional options to help maintain a long life.
Raw Milk vs. Pasteurized Milk
In support of the raw milk community and the education of dairy consumers, Natural News has published an infographic about organic raw (fresh) milk versus conventional (pasteurized) milk. This infographic reveals the crucial differences between the nutritional properties, animal compassion and health implications of raw milk versus pasteurized milk.

The Future of ATMs
This infographic explores five-year trends, predictions, opportunities and challenges for the ATM industry.
10 Reasons To Realign Your Website
Your website content, design and goals should be revisited on a regular basis in order to have the best success. Realigning your website to meet your ever changing online objectives and user needs is part of that success process. The following infographic provides 10 reasons to realign your sit along with some thought provoking questions to get you started.
Health Headaches: Why Do We Avoid Our Doctors
Health – or the absence of it – is one of America’s primary concerns. However, as obsessed as we are with our health, we often fare poorly when it comes to maintaining it. We avoid sharing personal problems with our primary care providers and sometimes even neglect going to the doctor at all. Why aren’t we taking care of ourselves and even more importantly, how can this be fixed?
Top 10 Internet IPOs Over the Last 10 Years
Many like myself are anxiously waiting to see how Facebook’s IPO will go once it is public. But what about some of the other Internet-based companies and their IPOs? How well did they fare and more importantly, how are they doing today? This infographic takes a look at the top 10 Internet IPOs over the last 10 years.
Website Testing: Move Beyond the Landing Page
Smart marketers understand the value of testing. In a relatively short period of time, website testing has evolved from changing the color of a “submit” button on one web page, to building intricate, multi-page testing campaigns with the ultimate goal of delivering an engaging online experience to customers.
Legal Weed’s Top 10 Greatest Hits
The Internet has been having a lot of fun with weed over the last year, and WeedMaps hopes to contribute with their new infographic. The Top 10 Greatest “Hits” explores different strains and uses of medicinal marijuana.
Beware of These Internet Related Illnesses
Using the Internet daily has become almost unavoidable these days. However having the Internet at your fingertips at all times might not always be a positive thing. According to a recently published study in General Hospital Psychiatry, excessive use of the Internet can cause Internet Addiction Disorder, or IAD, which can lead to anxiety and depression.
I Need to Get a WHAT!?
Colorectal cancer is one of the most commonly diagnosed cancers in the United States. According to a study published in the New England Journal of Medicine, removing precancerous growths found during a colonoscopy can cut the risk of dying from colon cancer in half. Less than half of adults over the age of 50 have been screened, mainly because they are afraid of the test.
The Scenic Route to a Longer Life
There are certain widely accepted paths to good health and a longer life. But if quitting smoking, eating a balanced diet, and maintaining a healthy weight aren’t your thing, what’s an aspiring centenarian to do?The following infographic from Confused.com provides some additional options to help maintain a long life.
Raw Milk vs. Pasteurized Milk
In support of the raw milk community and the education of dairy consumers, Natural News has published an infographic about organic raw (fresh) milk versus conventional (pasteurized) milk. This infographic reveals the crucial differences between the nutritional properties, animal compassion and health implications of raw milk versus pasteurized milk.
The Future of ATMs
This infographic explores five-year trends, predictions, opportunities and challenges for the ATM industry.
10 Reasons To Realign Your Website
Your website content, design and goals should be revisited on a regular basis in order to have the best success. Realigning your website to meet your ever changing online objectives and user needs is part of that success process. The following infographic provides 10 reasons to realign your sit along with some thought provoking questions to get you started.
Health Headaches: Why Do We Avoid Our Doctors
Health – or the absence of it – is one of America’s primary concerns. However, as obsessed as we are with our health, we often fare poorly when it comes to maintaining it. We avoid sharing personal problems with our primary care providers and sometimes even neglect going to the doctor at all. Why aren’t we taking care of ourselves and even more importantly, how can this be fixed?
Partners


Browse Archives By Category
Animated Infographics
Business Infographics
Career & Jobs Infographics
Education Infographics
Entertainment Industry Infographics
Environmental Infographics
Finance & Money Infographics
Food & Drink Infographics
Health Infographics
Historical Infographics
Home & Garden Infographics
Internet Infographics
Law and Legal Infographics
Lifestyle Infographics
Marketing Infographics
Offbeat Infographics
Parenting Infographics
Pets & Animals Infographics
Political Infographics
Shopping Infographics
Sports and Athletic Infographics
Technology Infographics
Transportation Infographics
Travel Infographics
Video Infographics