


Search 12,100+ Infographics!
One Nation Under Hops: The U.S. Independent Beer Movement
Over the last few decades, small, independent breweries in the U.S. have been quietly growing. And though large breweries outpace smaller ones in annual production, craft beers are using their local roots, small scale, and unique offerings to attract devout followers and loyal customers.
Maternity Leave: American Moms Deserve Better
Some Americans believe that emerging nations are unable to provide basic necessities and that so-called socialist states are indifferent to individual needs. The numbers tell a happier story, in regards to newborns and mothers across the globe. But how about those in America?
Going Up: Elevators in Skyscrapers
Elevators are very interesting machines that most of us never think about. We often don’t consider it, but all elevators differ in size, speed, distance traveled, and several other aspects. This infographic is here to give us some interesting facts and figures on something most of us take for granted.
A Marketer’s Guide To Pinterest
For a closer look at how Pinterest has become a major marketing tool, MDG Advertising created this insightful infographic that illustrates the demographics, unique visitors, and companies jumping to get in on Pinterest’s popularity craze.

Is Your Nonprofit Eligible for a Google for Nonprofits Google Grant?
Did you know that Google gives out free advertising dollars to non-profit organizations? Did you also know that qualifying organizations could receive $10K or as much as $40K each month from Google to use for advertising and promoting their good cause? Want to find out if your non-profit organization is eligible?

Payroll and Tax Deductions
Most American workers aren’t aware of the factors that determine how much is deducted from their paychecks, yet it’s important to have that understanding so you can speak up about any errors. The following infographic from Paycor provides need-to-know information on payroll and tax deductions, and just in time for tax season.
The Evolution of Programming
From 1954 to present day, programming languages have evolved to change technology in many ways. This infographic takes a brief look at the evolution of programming and how the languages have changed to create advanced technological devices.

Turning The Tide: The Recession In Hawaii
Just like the really big island (United States), Hawaiians were hit by the recession as well, the state’s economy losing more than 30,000 jobs from 2006 – 2010. However, signs of life are springing up all over the islands – from construction to tourism, the wave of recovery is starting to swell.
Bridesmaids by the Numbers
Wedding tradition stands strong when it comes to bridesmaids. Of the 11 million bridesmaids in action each year, brides still like having this entourage to help her stand out. What’s probably changed the most is the cost of being a bridesmaid. There’s no getting around it—it’s an expensive honor as this infographic will reveal.
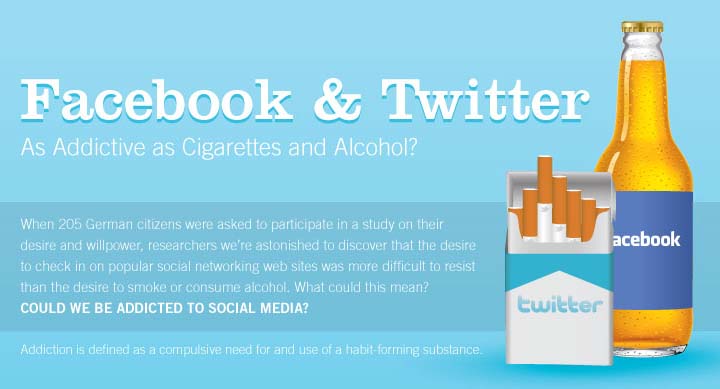
Facebook and Twitter as Addictive as Cigarettes & Alcohol
How much time do you spend on social media sites such as Facebook and Twitter? Social Media has created an atmosphere that is tough to walk away from. With smart phones and apps your friends and family are always with you. This infographic from ReuseThisBag.com will help you to see if you are addicted to social media.
One Nation Under Hops: The U.S. Independent Beer Movement
Over the last few decades, small, independent breweries in the U.S. have been quietly growing. And though large breweries outpace smaller ones in annual production, craft beers are using their local roots, small scale, and unique offerings to attract devout followers and loyal customers.
Maternity Leave: American Moms Deserve Better
Some Americans believe that emerging nations are unable to provide basic necessities and that so-called socialist states are indifferent to individual needs. The numbers tell a happier story, in regards to newborns and mothers across the globe. But how about those in America?
Going Up: Elevators in Skyscrapers
Elevators are very interesting machines that most of us never think about. We often don’t consider it, but all elevators differ in size, speed, distance traveled, and several other aspects. This infographic is here to give us some interesting facts and figures on something most of us take for granted.
A Marketer’s Guide To Pinterest
For a closer look at how Pinterest has become a major marketing tool, MDG Advertising created this insightful infographic that illustrates the demographics, unique visitors, and companies jumping to get in on Pinterest’s popularity craze.
Is Your Nonprofit Eligible for a Google for Nonprofits Google Grant?
Did you know that Google gives out free advertising dollars to non-profit organizations? Did you also know that qualifying organizations could receive $10K or as much as $40K each month from Google to use for advertising and promoting their good cause? Want to find out if your non-profit organization is eligible?
Payroll and Tax Deductions
Most American workers aren’t aware of the factors that determine how much is deducted from their paychecks, yet it’s important to have that understanding so you can speak up about any errors. The following infographic from Paycor provides need-to-know information on payroll and tax deductions, and just in time for tax season.
The Evolution of Programming
From 1954 to present day, programming languages have evolved to change technology in many ways. This infographic takes a brief look at the evolution of programming and how the languages have changed to create advanced technological devices.
Turning The Tide: The Recession In Hawaii
Just like the really big island (United States), Hawaiians were hit by the recession as well, the state’s economy losing more than 30,000 jobs from 2006 – 2010. However, signs of life are springing up all over the islands – from construction to tourism, the wave of recovery is starting to swell.
Bridesmaids by the Numbers
Wedding tradition stands strong when it comes to bridesmaids. Of the 11 million bridesmaids in action each year, brides still like having this entourage to help her stand out. What’s probably changed the most is the cost of being a bridesmaid. There’s no getting around it—it’s an expensive honor as this infographic will reveal.
Facebook and Twitter as Addictive as Cigarettes & Alcohol
How much time do you spend on social media sites such as Facebook and Twitter? Social Media has created an atmosphere that is tough to walk away from. With smart phones and apps your friends and family are always with you. This infographic from ReuseThisBag.com will help you to see if you are addicted to social media.
Partners


Browse Archives By Category
Animated Infographics
Business Infographics
Career & Jobs Infographics
Education Infographics
Entertainment Industry Infographics
Environmental Infographics
Finance & Money Infographics
Food & Drink Infographics
Health Infographics
Historical Infographics
Home & Garden Infographics
Internet Infographics
Law and Legal Infographics
Lifestyle Infographics
Marketing Infographics
Offbeat Infographics
Parenting Infographics
Pets & Animals Infographics
Political Infographics
Shopping Infographics
Sports and Athletic Infographics
Technology Infographics
Transportation Infographics
Travel Infographics
Video Infographics