


Search 12,100+ Infographics!
Are Pets Good For Your Health?
Love, companionship and sloppy wet kisses are just a few of the reasons people own pets. In fact, a whopping 62% of American households own at least one kind of pet, be that a dog, cat, bird or something else. In this infographic, for which I’m not sure who originally created it, you will learn more about the connection between our health and owning pets.
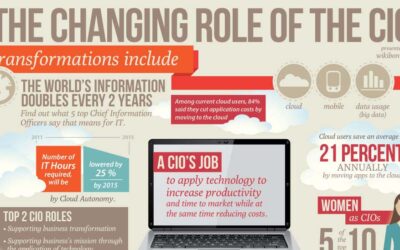
The Changing Role of the CIO
This infographic from Wikibon explores the varying and changing roles of the Chief Information Officer. The prominence of the CIO position has risen greatly as information technology has become an increasingly important aspect of the modern organization.

Baby Benefits: Is Your Company Offering Enough Maternity Leave?
Despite the long history of fighting for workers’ rights in this country and the cultural buzz around “family values,” the U.S. actually offers some of the weakest paid family leave benefits in the world. Though some individual states offer employees guaranteed paid family leave, a majority of new parents in the American workforce do not have many options for taking a leave.
What It Will Cost You To Go To Superbowl XLVI?
In this infographic, SeatGeek, a data-driven sports and concert ticket search engine, takes a deeper look at the all-in cost of attending this week’s Super Bowl XLVI in Indianapolis. Unless you have deep deep pockets, you might want to watch the game from the comfort of your own home.
Valentine’s Day Rocks or Sucks
When it comes to Valentine’s Day you either love it or hate it. Here are some reasons why Valentine’s Day rocks/sucks for both couples and singles. For couples you either love the whole production of the day or you feel pressured to be romantic and buy gifts. And if you’re single you either get together with your friends and celebrate SAD (Single Awareness Day) or you feel guilted and lonely by this forced commercial holiday.
One Isn’t the Loneliest Number This Valentine’s Day
Once all the New Year’s Eve celebrations are wrapped up, only one other day brings as much anxiety and awareness of singlehood – Valentine’s Day. February 14th is fast approaching, along with its endless stream of couples, roses, chocolates and hearts. But instead of wallowing in sorrow over being a party of one, take comfort in a new survey conducted by Pew Research. Turns out, more Americans are single than ever before. This infographic from CouponCabin takes a look at this research.
Finding Love in the Digital Age
With online dating being the third most popular way for singles to meet beyond friends and family in 2010 (according to Match.com), along with sex and intimacy drastically being affected by the Internet and the digital age,the Sexual Recovery Institute has used its expertise to capture this trending topic by creating an infographic.
Facebook Numbers Prior to the IPO
On the heel of the news over the fact that Facebook is getting ready to file for an initial public offering this week, and most indicators point to $10 billion in stock and a valuation at over $100 billion, Statista has put together stats on the company’s mind-boggling ascendance in recent years in the following infographic.
Career Advantage: Patriots Fans vs. Giants Fans
Whichever team comes out as Superbowl champions between the Giants and the Patriots, it will be a big payday for the winning team’s players. But, what about their fans? PayScale’s career scoring system shows one team’s supporters scoring better incomes, a higher quality of life and more employment opportunities in this infographic entitled “Fan Face-Off XLVI.”
College and the Drunken Coed
In this infographic from Total DUI, learn which campuses across the nation actually expel you for DUI as well as some other interesting facts and figures related to college drinking.
Are Pets Good For Your Health?
Love, companionship and sloppy wet kisses are just a few of the reasons people own pets. In fact, a whopping 62% of American households own at least one kind of pet, be that a dog, cat, bird or something else. In this infographic, for which I’m not sure who originally created it, you will learn more about the connection between our health and owning pets.
The Changing Role of the CIO
This infographic from Wikibon explores the varying and changing roles of the Chief Information Officer. The prominence of the CIO position has risen greatly as information technology has become an increasingly important aspect of the modern organization.
Baby Benefits: Is Your Company Offering Enough Maternity Leave?
Despite the long history of fighting for workers’ rights in this country and the cultural buzz around “family values,” the U.S. actually offers some of the weakest paid family leave benefits in the world. Though some individual states offer employees guaranteed paid family leave, a majority of new parents in the American workforce do not have many options for taking a leave.
What It Will Cost You To Go To Superbowl XLVI?
In this infographic, SeatGeek, a data-driven sports and concert ticket search engine, takes a deeper look at the all-in cost of attending this week’s Super Bowl XLVI in Indianapolis. Unless you have deep deep pockets, you might want to watch the game from the comfort of your own home.
Valentine’s Day Rocks or Sucks
When it comes to Valentine’s Day you either love it or hate it. Here are some reasons why Valentine’s Day rocks/sucks for both couples and singles. For couples you either love the whole production of the day or you feel pressured to be romantic and buy gifts. And if you’re single you either get together with your friends and celebrate SAD (Single Awareness Day) or you feel guilted and lonely by this forced commercial holiday.
One Isn’t the Loneliest Number This Valentine’s Day
Once all the New Year’s Eve celebrations are wrapped up, only one other day brings as much anxiety and awareness of singlehood – Valentine’s Day. February 14th is fast approaching, along with its endless stream of couples, roses, chocolates and hearts. But instead of wallowing in sorrow over being a party of one, take comfort in a new survey conducted by Pew Research. Turns out, more Americans are single than ever before. This infographic from CouponCabin takes a look at this research.
Finding Love in the Digital Age
With online dating being the third most popular way for singles to meet beyond friends and family in 2010 (according to Match.com), along with sex and intimacy drastically being affected by the Internet and the digital age,the Sexual Recovery Institute has used its expertise to capture this trending topic by creating an infographic.
Facebook Numbers Prior to the IPO
On the heel of the news over the fact that Facebook is getting ready to file for an initial public offering this week, and most indicators point to $10 billion in stock and a valuation at over $100 billion, Statista has put together stats on the company’s mind-boggling ascendance in recent years in the following infographic.
Career Advantage: Patriots Fans vs. Giants Fans
Whichever team comes out as Superbowl champions between the Giants and the Patriots, it will be a big payday for the winning team’s players. But, what about their fans? PayScale’s career scoring system shows one team’s supporters scoring better incomes, a higher quality of life and more employment opportunities in this infographic entitled “Fan Face-Off XLVI.”
College and the Drunken Coed
In this infographic from Total DUI, learn which campuses across the nation actually expel you for DUI as well as some other interesting facts and figures related to college drinking.
Partners


Browse Archives By Category
Animated Infographics
Business Infographics
Career & Jobs Infographics
Education Infographics
Entertainment Industry Infographics
Environmental Infographics
Finance & Money Infographics
Food & Drink Infographics
Health Infographics
Historical Infographics
Home & Garden Infographics
Internet Infographics
Law and Legal Infographics
Lifestyle Infographics
Marketing Infographics
Offbeat Infographics
Parenting Infographics
Pets & Animals Infographics
Political Infographics
Shopping Infographics
Sports and Athletic Infographics
Technology Infographics
Transportation Infographics
Travel Infographics
Video Infographics