


Search 12,100+ Infographics!
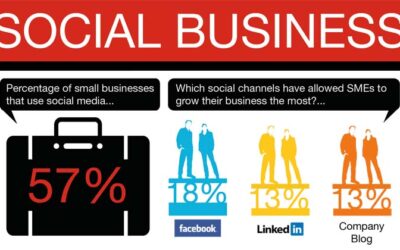
How Businesses Use Social Media
This infographic from Hiscox Insurance describes how small businesses use social media. It is clear that with 60% of small businesses using social media and 53% of adults who use social media, actually follow brands, it is vital that social media is used by small businesses to stay ahead of their competition.
Food Labeling and What You Should Know
A genetically modified organism (GMO) or genetically engineered organism (GEO) is an organism whose genetic material has been altered using genetic engineering techniques. These techniques, generally known as recombinant DNA technology, use DNA molecules from different sources, which are combined into one molecule to create a new set of genes. This and other interesting data on food labeling in this infographic.
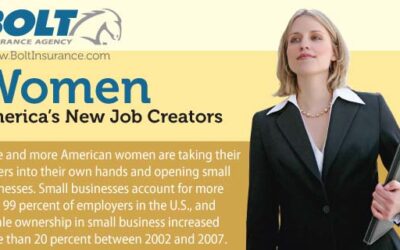
Women: America’s New Job Creators
More and more American women are taking their careers into their own hands and opening small businesses. Small businesses account for more than 99 percent of employers in the U.S., and female ownership in small business increased more than 20 percent between 2002 and 2007. These and other interesting statistics on women in business from Bolt Insurance Agency.
Traveling by Air: Tips, Tricks & Debunked Myths
While booking a flight might be stressful, you can alleviate many of your travel woes by having the right information. Use these great facts provided in infographic format to make smart travel decisions booking your next flight.
The Rise of the SoMoLo Shopper
Commerce in Motion offers a compelling and creative look at how current technology trends in social media, mobility, and location-based services are creating a new breed of shopper – the SoMoLo shopper. These are consumers who regularly use social networks and apps, smart phones and location based services as part of their shopping lifestyle.
How To Spot a Yelp User
Yelp users certainly have a unique way of seeing and interacting with the world. You can easily recognize one by their penchant for food photography and need to review everything from parking lots to laundromats.This infographic takes a humorous look at the average Yelp user.
Bill Gates Is Better Than Batman
Bill Gates has accumulated a tremendous amount of wealth in his lifetime. He has also given alot of it away, for the good. His philanthropic work has helped to eradicate polio internationally as well as improve the U.S. education system, saving 5 million lives and counting. This infographic proves beyond a shadow of a doubt that Bill Gates is a better super hero than Batman.

5 Simple Steps to Create a Google+ Business Page
Google has announced the launch of Google+ Pages, which are designed specifically for businesses on Google+, as opposed to Google+ Profiles designed for individuals. It is a good idea to set up your Google+ Page as quickly as you can and its a relatively simple process. This infographic will show you the 5 steps to help you on your way.
Mobile Trends for 2012
With the growing number of Smartphone users, what will be the key trends for mobile in 2012? This infographic from Vocal highlights the direction mobile is taking in terms of apps and services and what consumers and businesses should look out for in 2012.
The Problems with Passwords
More and more of our lives are taking place online which means that quite regularly we are trusting our personal information to the cloud. Unfortunately, it seems we still have not learned how to protect ourselves. This infographic is the results of a study conducted in 2011 with 300 people ranging from high school students to adults that looks at the mistakes that are made with passwords.
How Businesses Use Social Media
This infographic from Hiscox Insurance describes how small businesses use social media. It is clear that with 60% of small businesses using social media and 53% of adults who use social media, actually follow brands, it is vital that social media is used by small businesses to stay ahead of their competition.
Food Labeling and What You Should Know
A genetically modified organism (GMO) or genetically engineered organism (GEO) is an organism whose genetic material has been altered using genetic engineering techniques. These techniques, generally known as recombinant DNA technology, use DNA molecules from different sources, which are combined into one molecule to create a new set of genes. This and other interesting data on food labeling in this infographic.
Women: America’s New Job Creators
More and more American women are taking their careers into their own hands and opening small businesses. Small businesses account for more than 99 percent of employers in the U.S., and female ownership in small business increased more than 20 percent between 2002 and 2007. These and other interesting statistics on women in business from Bolt Insurance Agency.
Traveling by Air: Tips, Tricks & Debunked Myths
While booking a flight might be stressful, you can alleviate many of your travel woes by having the right information. Use these great facts provided in infographic format to make smart travel decisions booking your next flight.
The Rise of the SoMoLo Shopper
Commerce in Motion offers a compelling and creative look at how current technology trends in social media, mobility, and location-based services are creating a new breed of shopper – the SoMoLo shopper. These are consumers who regularly use social networks and apps, smart phones and location based services as part of their shopping lifestyle.
How To Spot a Yelp User
Yelp users certainly have a unique way of seeing and interacting with the world. You can easily recognize one by their penchant for food photography and need to review everything from parking lots to laundromats.This infographic takes a humorous look at the average Yelp user.
Bill Gates Is Better Than Batman
Bill Gates has accumulated a tremendous amount of wealth in his lifetime. He has also given alot of it away, for the good. His philanthropic work has helped to eradicate polio internationally as well as improve the U.S. education system, saving 5 million lives and counting. This infographic proves beyond a shadow of a doubt that Bill Gates is a better super hero than Batman.
5 Simple Steps to Create a Google+ Business Page
Google has announced the launch of Google+ Pages, which are designed specifically for businesses on Google+, as opposed to Google+ Profiles designed for individuals. It is a good idea to set up your Google+ Page as quickly as you can and its a relatively simple process. This infographic will show you the 5 steps to help you on your way.
Mobile Trends for 2012
With the growing number of Smartphone users, what will be the key trends for mobile in 2012? This infographic from Vocal highlights the direction mobile is taking in terms of apps and services and what consumers and businesses should look out for in 2012.
The Problems with Passwords
More and more of our lives are taking place online which means that quite regularly we are trusting our personal information to the cloud. Unfortunately, it seems we still have not learned how to protect ourselves. This infographic is the results of a study conducted in 2011 with 300 people ranging from high school students to adults that looks at the mistakes that are made with passwords.
Partners


Browse Archives By Category
Animated Infographics
Business Infographics
Career & Jobs Infographics
Education Infographics
Entertainment Industry Infographics
Environmental Infographics
Finance & Money Infographics
Food & Drink Infographics
Health Infographics
Historical Infographics
Home & Garden Infographics
Internet Infographics
Law and Legal Infographics
Lifestyle Infographics
Marketing Infographics
Offbeat Infographics
Parenting Infographics
Pets & Animals Infographics
Political Infographics
Shopping Infographics
Sports and Athletic Infographics
Technology Infographics
Transportation Infographics
Travel Infographics
Video Infographics