


Search 12,100+ Infographics!
World Tourism Facts and Figures in 2011
The tourism industry is a major contributor to the overall global economy. Here is a travel infographic presenting facts, figures and stats on world tourism in 2011.
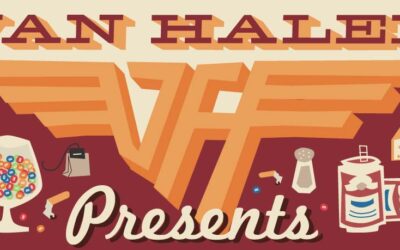
The Infamous Van Halen Tour Rider
The year was 1982 with one of the world’s most ostentatious glam rock bands, Van Halen, kicking off a massive tour, but not before sending its demands to the venues it would be playing at. In what is considered to be one of the most ridiculous riders of all time.
The Real Cost of Sleeping in Hotels
CreditDonkey has put together this cute infographic that explores the real cost of staying in a hotel room. Things can add up very quickly. Additionally some tips on utilizing travel awards are presented.
Google Page Rank Race
It common knowledge among SEO types that Google looks at page load time as a key criteria in page ranking. This infographic provides tricks and tips that will help make web page load time faster.
The Value of Being LinkedIn
This infographic published by Online MBA provides data on Linkedin, a resume sharing and networking site, and helps one to determine if it’s valuable to join the Linkedin community.
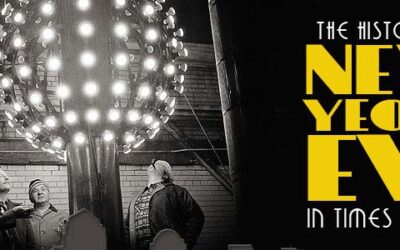
History of New Year’s Eve in Times Square
From 1904 to present times, Times Square in New York City has a rich history in the celebration of the new year with their annual New Years Eve celebrations. This infographic published by CityPASS looks at its history.
America’s Pet Frenzy: Finding the Balance
How much do people spend annually on their pets? Do we have a pet “overpopulation” dilemma? And what about the health of pets vs. humans. Learn answers to these questions and more in this infographic.
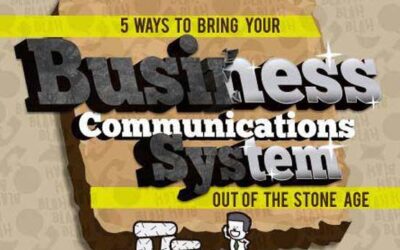
Tips to Upgrade Your Business Communications System
As communication technology continues to advance, options for business communication solutions grow. But why change from older existing systems to new advanced platforms? Well, it turns out there are some very compelling reasons to upgrade to advanced service providers whose benefits can directly affect a company’s bottom line and making the change can be more seamless than many realize.
College Bowl Games: How Much of a Big (Money) Deal Are They?
The holidays are a time of food, family, gifts, celebrations… and college football. These games are a great source of entertainment but in all reality they’re more than that: they’re also big money. In this infographic, we take a look at some of the stats of this season’s biggest games to get a glimpse at just how big of a deal bowl season is.
Keyword Research Process
The following infographic provides some basic information on how to go about conducting keyword research prior to an online marketing effort.
World Tourism Facts and Figures in 2011
The tourism industry is a major contributor to the overall global economy. Here is a travel infographic presenting facts, figures and stats on world tourism in 2011.
The Infamous Van Halen Tour Rider
The year was 1982 with one of the world’s most ostentatious glam rock bands, Van Halen, kicking off a massive tour, but not before sending its demands to the venues it would be playing at. In what is considered to be one of the most ridiculous riders of all time.
The Real Cost of Sleeping in Hotels
CreditDonkey has put together this cute infographic that explores the real cost of staying in a hotel room. Things can add up very quickly. Additionally some tips on utilizing travel awards are presented.
Google Page Rank Race
It common knowledge among SEO types that Google looks at page load time as a key criteria in page ranking. This infographic provides tricks and tips that will help make web page load time faster.
The Value of Being LinkedIn
This infographic published by Online MBA provides data on Linkedin, a resume sharing and networking site, and helps one to determine if it’s valuable to join the Linkedin community.
History of New Year’s Eve in Times Square
From 1904 to present times, Times Square in New York City has a rich history in the celebration of the new year with their annual New Years Eve celebrations. This infographic published by CityPASS looks at its history.
America’s Pet Frenzy: Finding the Balance
How much do people spend annually on their pets? Do we have a pet “overpopulation” dilemma? And what about the health of pets vs. humans. Learn answers to these questions and more in this infographic.
Tips to Upgrade Your Business Communications System
As communication technology continues to advance, options for business communication solutions grow. But why change from older existing systems to new advanced platforms? Well, it turns out there are some very compelling reasons to upgrade to advanced service providers whose benefits can directly affect a company’s bottom line and making the change can be more seamless than many realize.
College Bowl Games: How Much of a Big (Money) Deal Are They?
The holidays are a time of food, family, gifts, celebrations… and college football. These games are a great source of entertainment but in all reality they’re more than that: they’re also big money. In this infographic, we take a look at some of the stats of this season’s biggest games to get a glimpse at just how big of a deal bowl season is.
Keyword Research Process
The following infographic provides some basic information on how to go about conducting keyword research prior to an online marketing effort.
Partners


Browse Archives By Category
Animated Infographics
Business Infographics
Career & Jobs Infographics
Education Infographics
Entertainment Industry Infographics
Environmental Infographics
Finance & Money Infographics
Food & Drink Infographics
Health Infographics
Historical Infographics
Home & Garden Infographics
Internet Infographics
Law and Legal Infographics
Lifestyle Infographics
Marketing Infographics
Offbeat Infographics
Parenting Infographics
Pets & Animals Infographics
Political Infographics
Shopping Infographics
Sports and Athletic Infographics
Technology Infographics
Transportation Infographics
Travel Infographics
Video Infographics