


Search 12,100+ Infographics!
How Facebook Affects You and Your Relationships
The enormity of Facebook is changing the way we interact with each other. This infographic published by Online Schools provides details on how this social media giant is having an impact on relationships.

Military Vs. Civilian Salary
This infographic from Military Spot compares salaries among several civilian and military jobs including mechanics, chefs, and headhunters. Although the job can be the same with the same amount of work, in some cases one earns more money in the military and while others as a civilians.
The Darwinian Evolution of Microsoft Windows
Since its inception, the Microsoft Windows operating system has gone through quite a bit of evolution. The following infographic from Tech King outlines the history and current status of the world’s most popular operating system.
Planet Text: How SMS Messaging is Changing the World
This infographic published by MBAOnline.com provides statistical data regarding the number of texters around the world including specific examples of how text messages are changing the world through texting with banks, governments and health care systems.
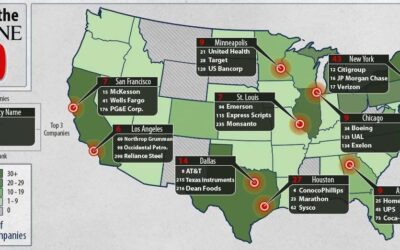
Visualizing the Fortune 500
This infographic offers a organized visual of Fortune 500 companies and where they are located in the U.S., including their location by state and by city. It also list the top industries by growth and the top industries by profit.
Interesting Statue of Liberty Statistics
Did you ever wonder what the different parts of the Statue of Liberty represent? Discover everything you ever wanted to know about this famous New York destination in this infographic published by CityPASS.

Deconstructing a Safe Room
Simply put, a safe room is a secure, reinforced, well-stocked room where individuals can go to avoid the risks and potential dangers that may arise in other parts of a home. But how do you create a safe room in your house? This infographic provides some ideas.
The Benefits of Plants
In this interesting infographic, you will learn more about the benefits of plants and why they are important for our health and the environment.
World Famous San Francisco Cable Cars
In this infographic published by CityPASS, you will learn the history of the world famous San Francisco cable cars along with interesting facts on how they work.
Google’s Long History of Forays Into Social Media
This infographic from Mashable provides a timeline with a brief description of each time that Google has attempted to grow it’s social media market by company acquisition, social media app creation, and through deals with social media sites.
How Facebook Affects You and Your Relationships
The enormity of Facebook is changing the way we interact with each other. This infographic published by Online Schools provides details on how this social media giant is having an impact on relationships.
Military Vs. Civilian Salary
This infographic from Military Spot compares salaries among several civilian and military jobs including mechanics, chefs, and headhunters. Although the job can be the same with the same amount of work, in some cases one earns more money in the military and while others as a civilians.
The Darwinian Evolution of Microsoft Windows
Since its inception, the Microsoft Windows operating system has gone through quite a bit of evolution. The following infographic from Tech King outlines the history and current status of the world’s most popular operating system.
Planet Text: How SMS Messaging is Changing the World
This infographic published by MBAOnline.com provides statistical data regarding the number of texters around the world including specific examples of how text messages are changing the world through texting with banks, governments and health care systems.
Visualizing the Fortune 500
This infographic offers a organized visual of Fortune 500 companies and where they are located in the U.S., including their location by state and by city. It also list the top industries by growth and the top industries by profit.
Interesting Statue of Liberty Statistics
Did you ever wonder what the different parts of the Statue of Liberty represent? Discover everything you ever wanted to know about this famous New York destination in this infographic published by CityPASS.
Deconstructing a Safe Room
Simply put, a safe room is a secure, reinforced, well-stocked room where individuals can go to avoid the risks and potential dangers that may arise in other parts of a home. But how do you create a safe room in your house? This infographic provides some ideas.
The Benefits of Plants
In this interesting infographic, you will learn more about the benefits of plants and why they are important for our health and the environment.
World Famous San Francisco Cable Cars
In this infographic published by CityPASS, you will learn the history of the world famous San Francisco cable cars along with interesting facts on how they work.
Google’s Long History of Forays Into Social Media
This infographic from Mashable provides a timeline with a brief description of each time that Google has attempted to grow it’s social media market by company acquisition, social media app creation, and through deals with social media sites.
Partners


Browse Archives By Category
Animated Infographics
Business Infographics
Career & Jobs Infographics
Education Infographics
Entertainment Industry Infographics
Environmental Infographics
Finance & Money Infographics
Food & Drink Infographics
Health Infographics
Historical Infographics
Home & Garden Infographics
Internet Infographics
Law and Legal Infographics
Lifestyle Infographics
Marketing Infographics
Offbeat Infographics
Parenting Infographics
Pets & Animals Infographics
Political Infographics
Shopping Infographics
Sports and Athletic Infographics
Technology Infographics
Transportation Infographics
Travel Infographics
Video Infographics