


Search 12,100+ Infographics!

The World of Online Music
Online music has evolved quite a bit in the past 10 years, with the rise and fall of many offerings. This Infographic provides some interesting statistics around the world of online music.
Jet Lag Demystified
Did you know that flying westward causes less jet lag than flying eastward? In this Infographic, learn why jet lag can occur and tips on how to avoid the symptoms.
Visual History of the Christmas Tree
The history of the Christmas tree has garnered a lot of fascinating points over the years. From the first decorated tree in 1600 to Gubbio, Italy’s 650-meter tall wonder, get a glimpse of Christmas tree history through this handy visual guide.
How To Increase Video Viewership
Video is very quickly becoming what a website was a decade ago – something that gives nimble, early adopters an edge over the competition. However, if time and money are going to be spent making a video, it also pays to analyze your video traffic and determine how to increase your viewership. This Infographic provides guidelines to help fine tune video-making endeavors and maximize viewership.
Have a Safe Online Shopping Experience
This Infographic helps educate online shoppers as to what makes a site secure and advises them of certain things to look for when shopping (or browsing for comparisons) on smaller, lesser known sites.
Cyber Crime: Online Holiday Shoppers Beware
Did you know that consumers will lose more than $10 million this holiday season due to cyber crime? Discover how in this Infographic from F-Secure called “Online Shoppers Beware: What’s Lurking in Your Online Holiday Gift Purchase?”.
2011 Ipswitch Holiday Shopping Poll Results Revealed
WhatsUp Gold’s most recent survey of some of its 100,000 customers asked how long employees are spending shopping online leading up to the holidays. Shopping online is becoming the de facto route of choice for many during the festive season – comScore, a leader in measuring the digital world, earlier reported that holiday season spending thus far has topped $15 billion in the US alone, marking a 15% increase over last year.
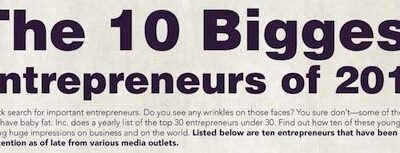
The 10 Biggest Entrepreneurs of 2011
This infographic by Business MBA looks into ten entrepreneurs who made Inc’s 2011 list of the 30 biggest entrepreneurs under the age of 30. Though many focus on technology, the young professionals have created businesses based around everything from food to biodiesel.

Teaching To The Test
The controversy surrounding No Child Left Behind and standardized testing may only be proving to be more and more inefficient. The new infographic by Best Masters in Education shows us where we are putting undo pressure and where we are no longer focusing.
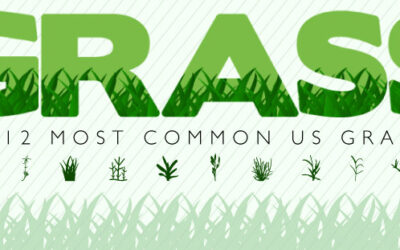
The 12 Most Common U.S. Grasses
This Infographic from grass-types.com provides a visual for the 12 most common grass types in the United States. It goes on to show how much water each type needs, what temperatures they survive in, what is their growing rate, mowing height, and price per pound.
The World of Online Music
Online music has evolved quite a bit in the past 10 years, with the rise and fall of many offerings. This Infographic provides some interesting statistics around the world of online music.
Jet Lag Demystified
Did you know that flying westward causes less jet lag than flying eastward? In this Infographic, learn why jet lag can occur and tips on how to avoid the symptoms.
Visual History of the Christmas Tree
The history of the Christmas tree has garnered a lot of fascinating points over the years. From the first decorated tree in 1600 to Gubbio, Italy’s 650-meter tall wonder, get a glimpse of Christmas tree history through this handy visual guide.
How To Increase Video Viewership
Video is very quickly becoming what a website was a decade ago – something that gives nimble, early adopters an edge over the competition. However, if time and money are going to be spent making a video, it also pays to analyze your video traffic and determine how to increase your viewership. This Infographic provides guidelines to help fine tune video-making endeavors and maximize viewership.
Have a Safe Online Shopping Experience
This Infographic helps educate online shoppers as to what makes a site secure and advises them of certain things to look for when shopping (or browsing for comparisons) on smaller, lesser known sites.
Cyber Crime: Online Holiday Shoppers Beware
Did you know that consumers will lose more than $10 million this holiday season due to cyber crime? Discover how in this Infographic from F-Secure called “Online Shoppers Beware: What’s Lurking in Your Online Holiday Gift Purchase?”.
2011 Ipswitch Holiday Shopping Poll Results Revealed
WhatsUp Gold’s most recent survey of some of its 100,000 customers asked how long employees are spending shopping online leading up to the holidays. Shopping online is becoming the de facto route of choice for many during the festive season – comScore, a leader in measuring the digital world, earlier reported that holiday season spending thus far has topped $15 billion in the US alone, marking a 15% increase over last year.
The 10 Biggest Entrepreneurs of 2011
This infographic by Business MBA looks into ten entrepreneurs who made Inc’s 2011 list of the 30 biggest entrepreneurs under the age of 30. Though many focus on technology, the young professionals have created businesses based around everything from food to biodiesel.
Teaching To The Test
The controversy surrounding No Child Left Behind and standardized testing may only be proving to be more and more inefficient. The new infographic by Best Masters in Education shows us where we are putting undo pressure and where we are no longer focusing.
The 12 Most Common U.S. Grasses
This Infographic from grass-types.com provides a visual for the 12 most common grass types in the United States. It goes on to show how much water each type needs, what temperatures they survive in, what is their growing rate, mowing height, and price per pound.
Partners


Browse Archives By Category
Animated Infographics
Business Infographics
Career & Jobs Infographics
Education Infographics
Entertainment Industry Infographics
Environmental Infographics
Finance & Money Infographics
Food & Drink Infographics
Health Infographics
Historical Infographics
Home & Garden Infographics
Internet Infographics
Law and Legal Infographics
Lifestyle Infographics
Marketing Infographics
Offbeat Infographics
Parenting Infographics
Pets & Animals Infographics
Political Infographics
Shopping Infographics
Sports and Athletic Infographics
Technology Infographics
Transportation Infographics
Travel Infographics
Video Infographics