


Search 12,100+ Infographics!
Get More Out of Google – Tips & Tricks For Students
There is a lot more to efficient Googling than you might think: in a recent study on student research skills, 3 out of 4 students couldn’t perform a “well-executed search” on Google. This very informative Infographic provides some beneficial tips to refining searching activity as well as some other great tricks to hunt down that last study you need for your thesis.
Black Friday and Cyber Monday – Go Tablet & Mobile
Testing service Monetate has released an infographic full of stats on desktop shopping compared to behaviors of mobile and tablet usage, based on data from their own service. Desktop shopping still takes 1st place but mobile and tablet is rising.
Holiday Toys – Then and Now
This Infographic from Pronto.com makes nostalgic comparisons between the classic holiday toys from the ‘70’s, ‘60’s and earlier, and their more modern and technological counterparts from today.
Anatomy of a Killer Facebook Ad Campaign
Creating a Facebook Page for your company has become essential for success in online marketing. This Infographic will walk you through the steps of accomplishing this as well as ensuring the best opportunity for success.
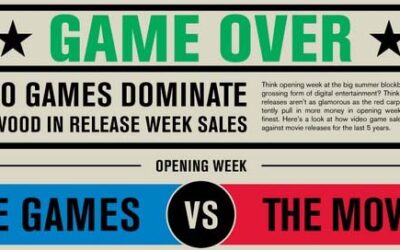
Game Over: Video Games Vs. Movies
You would think that new feature film releases would outsell new video game releases, right? Not so! This infographic from G Plus shows that the release of new video games consistently rank in more money than the release of new films.

Ten Core Innovation Strategies of New Product Leaders
What are the essential elements or the genetic structure of a high-performance team? After poring through 60 years of industry research and talking to dozens of companies, Ronald Brown has identified 10 core innovation strategies of new product leaders in this Infographic.
Holiday Spending Trends
Typically the holidays mark a time of overspending, overeating, and overindulgence. This Infographic reveals data on how much we actually spend during the holidays and provides some alternate gift ideas that can make impact.

How Diversity in the Workplace Can Help Drive Success
As companies continue to expand globally, executives understand that they can’t be successful if they ignore diversity and inclusion strategies. As more social business tools enter the workplace, it is becoming easier to bring diverse groups of people together to collaborate more effectively on projects and innovate even faster.
A Look at How We Waste Food
Admit it already – we all waste more food than we should. This Infographic illustrates the morbid statistics of food wastage in America and Europe compared to other parts of the world. You may be shocked.
Population of Planet Earth Hits 7 Billion
Earth’s population has hit an all time high topping out at 7 billion people. This has caused several important changes that can affect climate, social media, business and growth. This Infographic reveals some interesting statistics.
Get More Out of Google – Tips & Tricks For Students
There is a lot more to efficient Googling than you might think: in a recent study on student research skills, 3 out of 4 students couldn’t perform a “well-executed search” on Google. This very informative Infographic provides some beneficial tips to refining searching activity as well as some other great tricks to hunt down that last study you need for your thesis.
Black Friday and Cyber Monday – Go Tablet & Mobile
Testing service Monetate has released an infographic full of stats on desktop shopping compared to behaviors of mobile and tablet usage, based on data from their own service. Desktop shopping still takes 1st place but mobile and tablet is rising.
Holiday Toys – Then and Now
This Infographic from Pronto.com makes nostalgic comparisons between the classic holiday toys from the ‘70’s, ‘60’s and earlier, and their more modern and technological counterparts from today.
Anatomy of a Killer Facebook Ad Campaign
Creating a Facebook Page for your company has become essential for success in online marketing. This Infographic will walk you through the steps of accomplishing this as well as ensuring the best opportunity for success.
Game Over: Video Games Vs. Movies
You would think that new feature film releases would outsell new video game releases, right? Not so! This infographic from G Plus shows that the release of new video games consistently rank in more money than the release of new films.
Ten Core Innovation Strategies of New Product Leaders
What are the essential elements or the genetic structure of a high-performance team? After poring through 60 years of industry research and talking to dozens of companies, Ronald Brown has identified 10 core innovation strategies of new product leaders in this Infographic.
Holiday Spending Trends
Typically the holidays mark a time of overspending, overeating, and overindulgence. This Infographic reveals data on how much we actually spend during the holidays and provides some alternate gift ideas that can make impact.
How Diversity in the Workplace Can Help Drive Success
As companies continue to expand globally, executives understand that they can’t be successful if they ignore diversity and inclusion strategies. As more social business tools enter the workplace, it is becoming easier to bring diverse groups of people together to collaborate more effectively on projects and innovate even faster.
A Look at How We Waste Food
Admit it already – we all waste more food than we should. This Infographic illustrates the morbid statistics of food wastage in America and Europe compared to other parts of the world. You may be shocked.
Population of Planet Earth Hits 7 Billion
Earth’s population has hit an all time high topping out at 7 billion people. This has caused several important changes that can affect climate, social media, business and growth. This Infographic reveals some interesting statistics.
Partners


Browse Archives By Category
Animated Infographics
Business Infographics
Career & Jobs Infographics
Education Infographics
Entertainment Industry Infographics
Environmental Infographics
Finance & Money Infographics
Food & Drink Infographics
Health Infographics
Historical Infographics
Home & Garden Infographics
Internet Infographics
Law and Legal Infographics
Lifestyle Infographics
Marketing Infographics
Offbeat Infographics
Parenting Infographics
Pets & Animals Infographics
Political Infographics
Shopping Infographics
Sports and Athletic Infographics
Technology Infographics
Transportation Infographics
Travel Infographics
Video Infographics