


Search 12,100+ Infographics!

‘Tis the Season for Security: New Device Protection Tips
’Tis the season to be jolly — and increasingly aware of our cyber safety. This is especially true when it comes to new device security, because cybercriminals are eager as ever to embrace the most wonderful time of the year. In this infographic, behold the top tech gifts over the 2020 holiday season, plus Norton’s new device security best practices to stay cyber safe through the holidays and beyond.

Packing Hacks for Your Move
Packing is one of the most important elements of moving. In fact, proper packing can save you time, protect your items, and keep them organized. This infographic will walk you through some tips that will help you pack for your next move.

Security & Beyond: Introduction To Electronic Access Control Systems
Keeping your organization safe is always top of mind. The more sensitive your operation, the more secure it must remain. Electronic Access Control Systems are smart security measures that can be implemented in offices/businesses to allow access only to authorized people. Here is an infographic that presents an introduction to Electronic Access Control Systems.
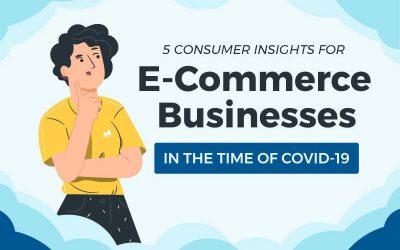
5 Consumer Insights for E-Commerce Businesses in the Time of COVID-19
COVID-19 has changed the landscape of consumer shopping. As people continue to adjust to the new normal, customers are shifting their focus to online spending. With the coronavirus pandemic, people may not go back to the way they used to shop before. In fact, even those who rarely or never bought online may be forced to do so during COVID-19.

The Problem With Low Quality Supplements
Supplements are supposed to make us healthier, not sicker. Yet, suspected vitamin overdoses have risen 35% since 1999. How? The Unwinder explains the problem with low quality supplements in the following infographic.
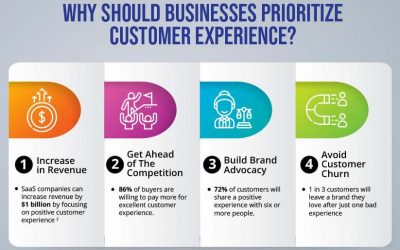
Gain Insights Into Your Customers & Target Segments With an Integrated Customer 360 View
In the modern enterprise, the customer reigns supreme. Instead of building key brand differentiation based on just price, product, or services, businesses now compete on delivering seamless omnichannel customer experiences. This infographic delves into the 360-degree data integration approach and explains how enterprises can leverage it for sustained business growth.

The Psychology of Naming Your Business
65% of people in America dream of starting a business. The first step in doing so? Choosing a great name. Find out how you can do so in this beautiful infographic, courtesy of WPBeginner – the ultimate WordPress resource guide. Have you picked a good name for your business?

The Effects of COVID-19 on the Global Gambling Market & Future Predictions
Nothing in recent years has shaken the global economy quite like the COVID-19 pandemic. One industry that has seen both the good and bad sides of the lockdown is the gambling industry. In this infographic, see the effects the virus has had on the global gambling market in 2020 and presented future prospects for the industry.

How Legendary Companies Make Money
Time is money. In this infographic, Gravy Solutions presents methods business owners can use to fix failed payments and increase customer loyalty. When’s the last time you heard out the needs of your clientele?
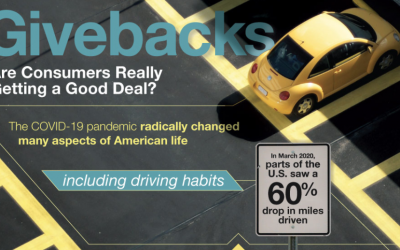
Auto Insurance Givebacks
To help drivers experiencing financial hardship during COVID-19, auto insurers are refunding premiums. Are policyholders getting a good deal? Find out in this infographic, courtesy of AutoInsurance.org.
‘Tis the Season for Security: New Device Protection Tips
’Tis the season to be jolly — and increasingly aware of our cyber safety. This is especially true when it comes to new device security, because cybercriminals are eager as ever to embrace the most wonderful time of the year. In this infographic, behold the top tech gifts over the 2020 holiday season, plus Norton’s new device security best practices to stay cyber safe through the holidays and beyond.
Packing Hacks for Your Move
Packing is one of the most important elements of moving. In fact, proper packing can save you time, protect your items, and keep them organized. This infographic will walk you through some tips that will help you pack for your next move.
Security & Beyond: Introduction To Electronic Access Control Systems
Keeping your organization safe is always top of mind. The more sensitive your operation, the more secure it must remain. Electronic Access Control Systems are smart security measures that can be implemented in offices/businesses to allow access only to authorized people. Here is an infographic that presents an introduction to Electronic Access Control Systems.
5 Consumer Insights for E-Commerce Businesses in the Time of COVID-19
COVID-19 has changed the landscape of consumer shopping. As people continue to adjust to the new normal, customers are shifting their focus to online spending. With the coronavirus pandemic, people may not go back to the way they used to shop before. In fact, even those who rarely or never bought online may be forced to do so during COVID-19.
The Problem With Low Quality Supplements
Supplements are supposed to make us healthier, not sicker. Yet, suspected vitamin overdoses have risen 35% since 1999. How? The Unwinder explains the problem with low quality supplements in the following infographic.
Gain Insights Into Your Customers & Target Segments With an Integrated Customer 360 View
In the modern enterprise, the customer reigns supreme. Instead of building key brand differentiation based on just price, product, or services, businesses now compete on delivering seamless omnichannel customer experiences. This infographic delves into the 360-degree data integration approach and explains how enterprises can leverage it for sustained business growth.
The Psychology of Naming Your Business
65% of people in America dream of starting a business. The first step in doing so? Choosing a great name. Find out how you can do so in this beautiful infographic, courtesy of WPBeginner – the ultimate WordPress resource guide. Have you picked a good name for your business?
The Effects of COVID-19 on the Global Gambling Market & Future Predictions
Nothing in recent years has shaken the global economy quite like the COVID-19 pandemic. One industry that has seen both the good and bad sides of the lockdown is the gambling industry. In this infographic, see the effects the virus has had on the global gambling market in 2020 and presented future prospects for the industry.
How Legendary Companies Make Money
Time is money. In this infographic, Gravy Solutions presents methods business owners can use to fix failed payments and increase customer loyalty. When’s the last time you heard out the needs of your clientele?
Auto Insurance Givebacks
To help drivers experiencing financial hardship during COVID-19, auto insurers are refunding premiums. Are policyholders getting a good deal? Find out in this infographic, courtesy of AutoInsurance.org.
Partners


Browse Archives By Category
Animated Infographics
Business Infographics
Career & Jobs Infographics
Education Infographics
Entertainment Industry Infographics
Environmental Infographics
Finance & Money Infographics
Food & Drink Infographics
Health Infographics
Historical Infographics
Home & Garden Infographics
Internet Infographics
Law and Legal Infographics
Lifestyle Infographics
Marketing Infographics
Offbeat Infographics
Parenting Infographics
Pets & Animals Infographics
Political Infographics
Shopping Infographics
Sports and Athletic Infographics
Technology Infographics
Transportation Infographics
Travel Infographics
Video Infographics